Managing IBM WebSphere Application Server 6.0 and above
To achieve this, do the following:
- Login to the eG administrative interface as admin.
-
Check if the WebSphere application server is already discovered. If already discovered, use the COMPONENTS - MANAGE/UNMANAGE page that appears on using the Infrastructure-> Components-> Manage/Unmanage menu to manage it. Otherwise, change the port information if needed and run discovery to discover it or manually add the WebSphere Server. For adding, use the COMPONENT page that can be accessed through the menu sequence Infrastructure -> Components -> Add/Modify. While components manually added are automatically managed, proceed to manually manage the discovered components using the COMPONENTS - MANAGE/UNMANAGE page.
-
Now, if you proceed to log out of the administrative interface, a list of unconfigured tests (see Figure 1) will appear prompting you to configure tests for the WebSphere Server.
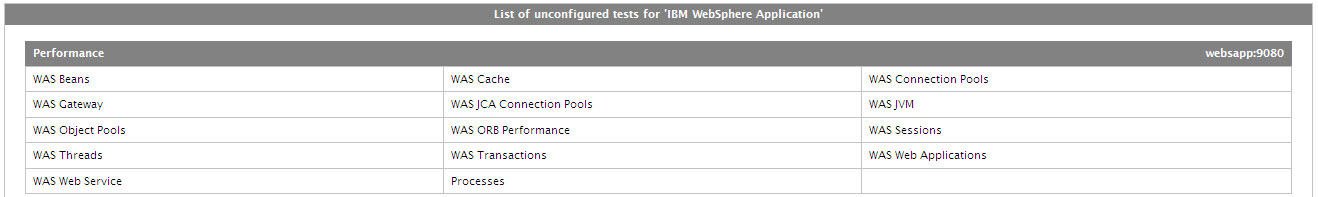
Figure 1 : A page displaying WebSphere tests to be configured
-
Click on, say, WAS Beans test to move to the page that facilitates test configuration (see Figure 2). This test reports the performance metrics that determines the functioning of the individual EJBs on the WAS server.
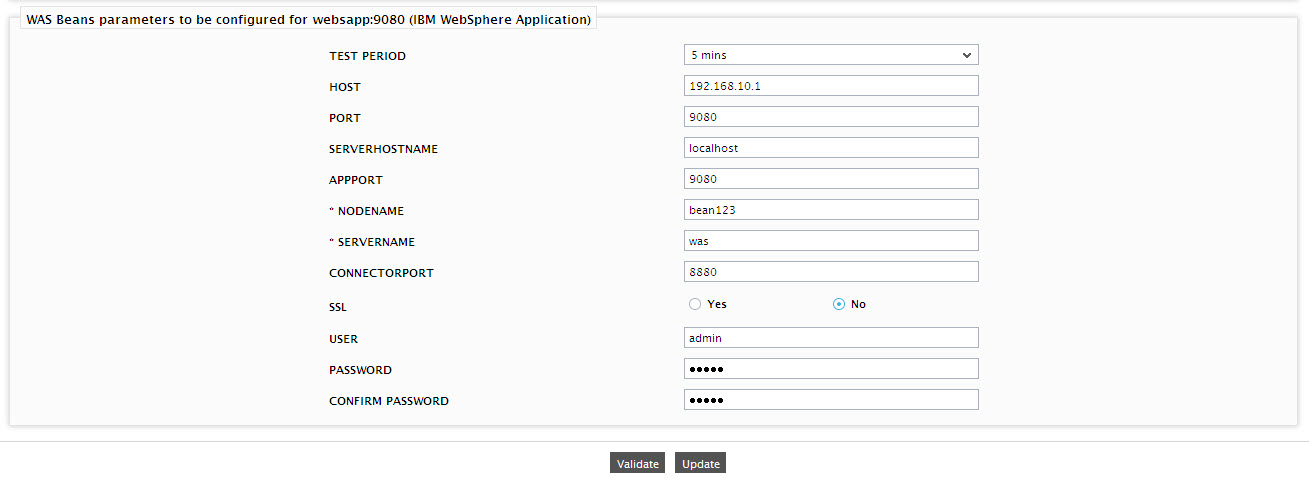
Figure 2 : Specifying the test parameters for a WebSphere application server
-
Here, select the WebSphere server for which the test is to be configured, click on the Configure button, and provide the following information:
- Test period - how often should the test be executed
- Host – The IP address of the WebSphere application server
- Port – The port number of the WebSphere application server
- serverhostname - Specify the host name of the application server instance being monitored.
- appPort – Specify the port number to be used for accessing the egurkha application that has been deployed on the server.
-
nodename - Specify the node name of the server instance being monitored. To know the node name, do the following:
- Login to the WebSphere Administrative Console.
-
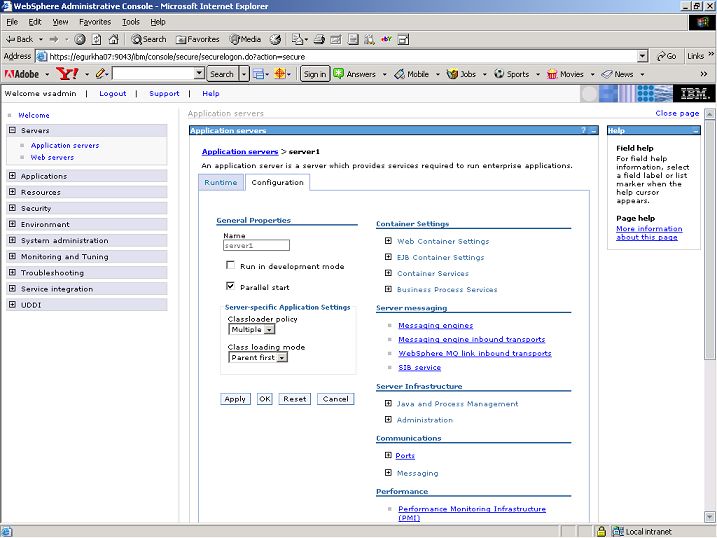
Expand the Servers node in the tree structure in the left pane of the console, and click on the Application servers link within (see Figure 3).
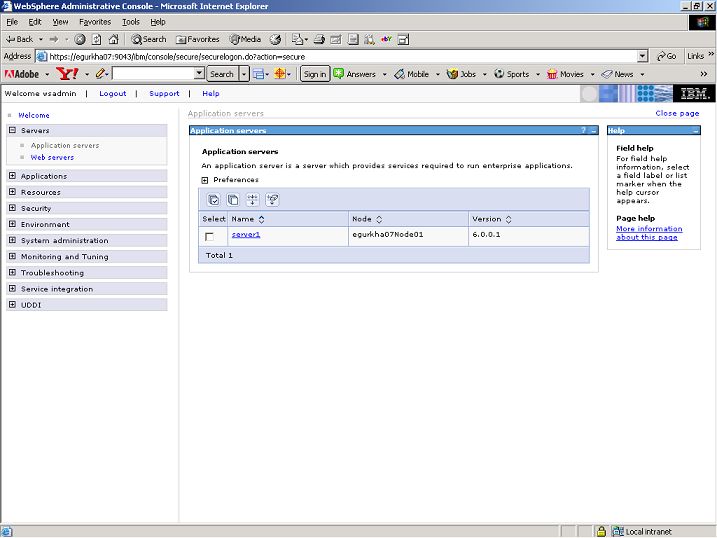
Figure 3 : The WebSphere Administrative Console displaying the list of application server instances
-
A list of application server instances and their corresponding node names will then appear in the right pane of the console. From this list, you can figure out the Node name that corresponds to the application server instance being monitored, and specify that name against the nodename parameter.
Note:
As websphere is case sensitive, make sure the node name is specified correctly.
-
servername – Provide the name of the server instance being monitored in the SERVERNAME text box. To know the server name, do the following:
- Login to the WebSphere Administrative Console.
-
Expand the Servers node in the tree structure in the left pane of the console, and click on the Application servers link within (see Figure 4).
- A list of server instance Names and their corresponding Node values will then be displayed in the right pane (see Figure 4).
- One of the displayed server instance Names can be specified as the value of the servername parameter.
If the server instance being monitored is part of a WebSphere cluster, then you need to provide the host name that corresponds to the connector port of the Deployment Manager of the cluster as the servername. To determine the servernamein this case, do the following:
- Connect to the WebSphere Administrative console using the URL: http://<DeploymentManagerIP>:<DeploymentManagerPort> .
-
Login to the WebSphere Administrative console. Figure 5 then appears.
Figure 5 : The Administrative console of the WebSphere Deployment Manager
-
Expand the System Administration node in the tree-structure in the left pane of the console and click on the Deployment Manager sub-node within.
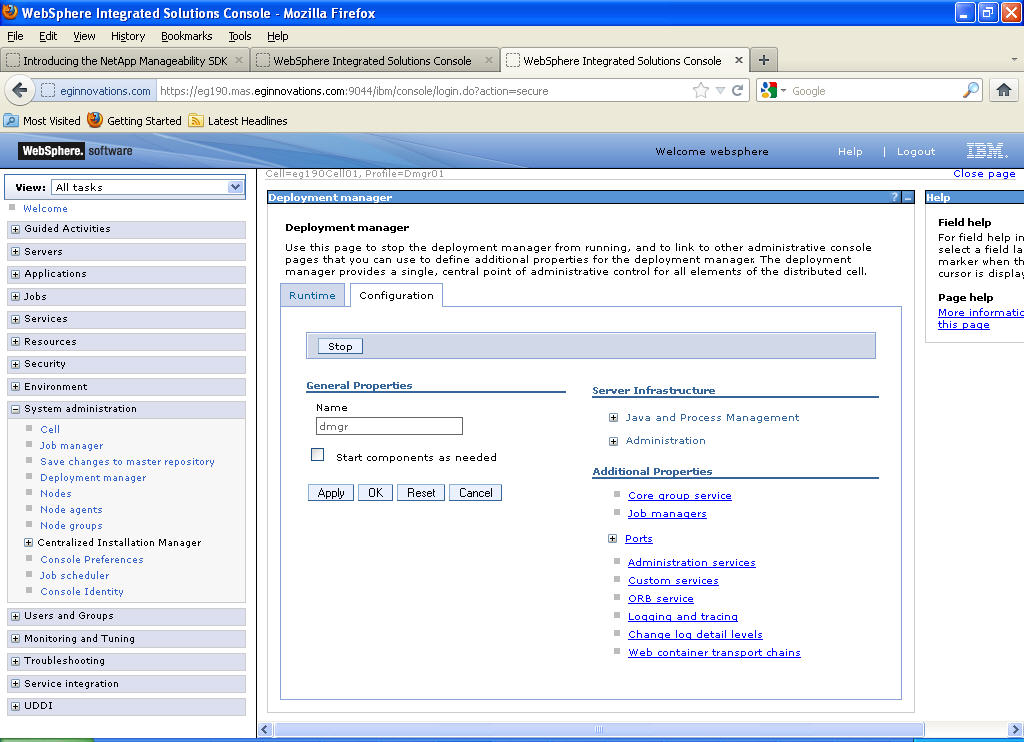
- In the right panel, click on the Configuration tab page to view the configuration of the Deployment Manager (see Figure 6). In the Additional Properties section of the Configuration tab page, expand the Ports node.
-
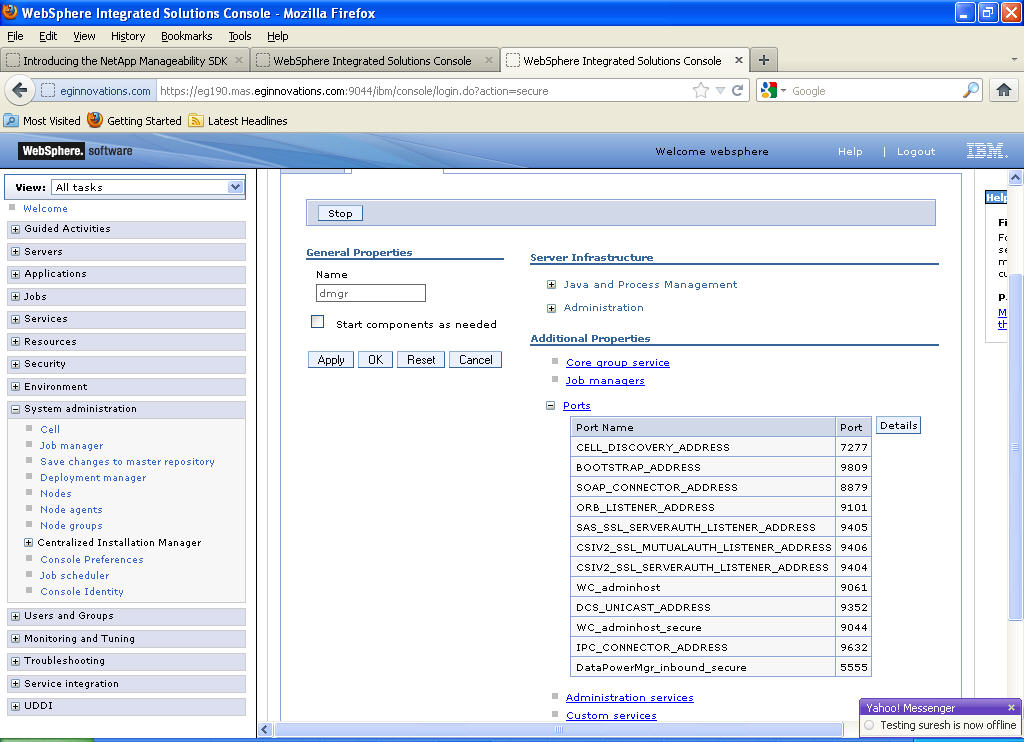
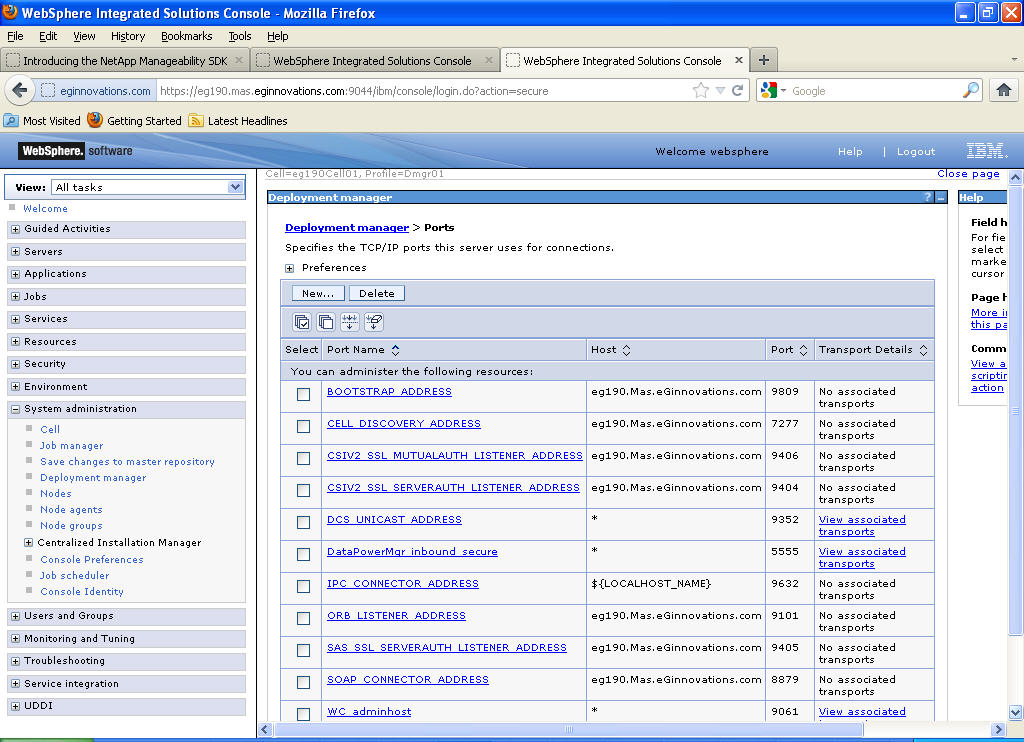
A list of ports will then appear. Click on the Details button alongside the ports list (see Figure 7).
-
If the SOAP port has been set as the connector port in your environment, then scroll down the page that appears next until you view the Port Name, SOAP_CONNECTOR_ADDRESS. Make note of the Host name that corresponds to this port name. If the RMI port is the connector port in your environment, then make note of the Host name that corresponds to the Port name, BOOTSTRAP_ADDRESS (see Figure 8).
- Specify this Host name as the servername.
-
connectorport - The applications that are deployed on a server instance use the CONNECTORPORT for all internal communications with the application server. The connector port can be a SOAP port or an RMI port. The default connector port however, is the SOAP port. To know the connector port number, do the following:
- Login to the WebSphere Administrative Console.
-
Expand the Servers node in the tree structure in the left pane of the console, and click on the Application servers link within (see Figure 9).
-
A list of application server instances and their corresponding node names will then appear in the right pane of the console. In the right pane, click on the server name link that corresponds to the server instance that is being monitored. Figure 10 revealing the Configuration of the server instance clicked on, then appears.
-
Scroll down the Configuration tab page to view the Communications section (see Figure 11).
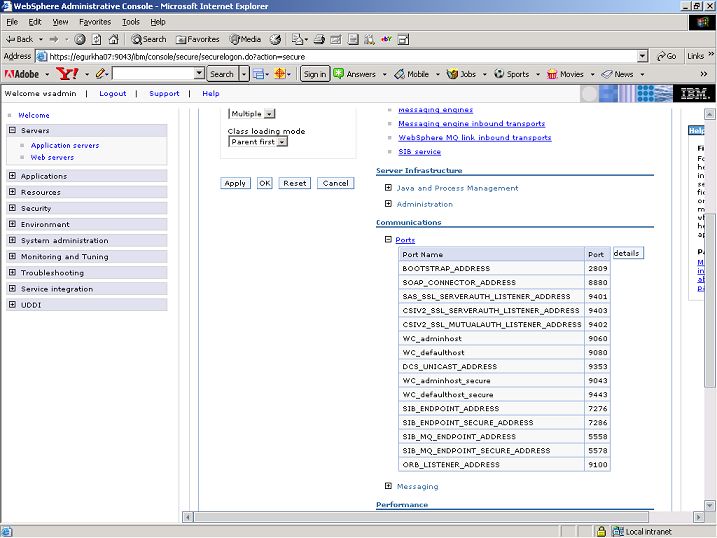
Figure 11 : Scrolling down to view the Communications section
- Expand the Ports link in the Configuration section (as depicted by Figure 11) to view a list of ports. If the default connector port is in use, then the port number displayed against SOAP_CONNECTOR_ADDRESS should be specified as the CONNECTORPORT. If an RMI port has been explicitly set as the connector port, then specify the port number displayed against BOOTSTRAP_ADDRESS as the CONNECTORPORT.
If the server instance being monitored is part of a WebSphere cluster, then you need to provide the connector port of the Deployment Manager of the cluster as the connectorport. To determine the connectorport in this case, do the following:
- Connect to the WebSphere Administrative console using the URL: http://<DeploymentManagerIP>:<DeploymentManagerPort> or https://<DeploymentManagerIP>:<DeploymentManagerPort> .
-
Login to the WebSphere Administrative console. Figure 12 then appears.
Figure 12 : The Administrative console of the WebSphere Deployment Manager
-
Expand the System Administration node in the tree-structure in the left pane of the console and click on the Deployment Manager sub-node within.
Figure 13 : The Deployment Manager Configuration
- In the right panel, click on the Configuration tab page to view the configuration of the Deployment Manager (see Figure 3.121). In the Additional Properties section of the Configuration tab page, expand the Ports node.
-
A list of ports will then appear. If the default connector port is in use, then the port number displayed against SOAP_CONNECTOR_ADDRESS should be specified as the CONNECTORPORT. If an RMI port has been explicitly set as the connector port, then specify the port number displayed against BOOTSTRAP_ADDRESS as the CONNECTORPORT.
Figure 14 : The list of ports on the Deployment Manager
- SSL – Select Yes if SSL (Secured Socket Layer) is to be used to connect to the WebSphere server, and No if it is not.
- user - If security has been enabled for the WebSphere server being monitored, then provide a valid USER name to login to the WebSphere server. While monitoring IBM Websphere Application server 8.x and above, if the user belongs to an external LDAP directory, then, ensure that the USER is assigned the Monitor role. If the WebSphere server does not require any authentication, then the USER text box should contain the default value 'none'.
- password – If security has been enabled for the WebSphere server being monitored, then provide the password that corresponds to the specified user name. If the WebSphere server does not require any authentication, then leave the password text box with its default setting.
- confirm password - If security has been confirm the specified password by retyping it in the confirm password text box. If the WebSphere server does not require any authentication, then leave the confirm password text box with its default setting.
-
DETAILED DIAGNOSIS - To make diagnosis more efficient and accurate, the eG Enterprise embeds an optional detailed diagnostic capability. With this capability, the eG agents can be configured to run detailed, more elaborate tests as and when specific problems are detected. To enable the detailed diagnosis capability of this test for a particular server, choose the On option. To disable the capability, click on the Off option.
The option to selectively enable/disable the detailed diagnosis capability will be available only if the following conditions are fulfilled:
- The eG manager license should allow the detailed diagnosis capability
- Both the normal and abnormal frequencies configured for the detailed diagnosis measures should not be 0.
- Then, click on the Update button to save the changes.
- Try to signout again; this time, you will be prompted to configure Processes test.
-
So, click on Processes test and proceed to configure it.
Note:
For Processes Test configuring procedure, refer to Configuring and Monitoring Mail Servers document.
-
Remember that the process pattern has to be specified in the following format:
PROCESSNAME:PROCESSPATTERN
For example, the process pattern can be specified as below:
WebSphere:*/opt/WebSphere/AppServer/java/jre/bin/exe/java*-Xmx128m*-Xminf0.15*-Xmaxf0.25*–X*
- Use the context sensitive eG help to understand more about how this process pattern is coined.
- Upon completion of Processes test configuration, signout of the administrative interface.
- The WebSphere Application server is now ready to be monitored by eG.