JEUS Server Status Test
This test auto-discovers all the instances of the JEUS server and reports the current running status of each server instance. In the process, this test also helps administrators to instantly identify the server instance that needs to be restarted. Using this test, administrators can find out the server instances that are currently down, and can restart the server instances (if needed) before anything untoward happens.
Target of the test : A JEUS Web Application Server
Agent deploying the test : An internal agent
Outputs of the test : One set of results for each server instance on the target server.
| Parameter | Description |
|
Test period |
How often should the test be executed. |
|
Host |
The host for which the test is to be configured. |
|
Port |
The port at which the specified host listens. By default, this is 9736. |
|
Username and Password |
To enable the eG agent to communicate and continuously monitor the target JEUS server, the eG agent should be configured with the credentials of the admin user on the server. In highly-secure environments, administrators may not want to expose the credentials of the user possessing administrator privileges. In such environments, for monitoring the JEUS application server, administrators have an option to create a new user on the JEUS server and assign administrator privilege to that user. The steps to create a new user with administrator privilege are explained in Creating a User with Administrator Privileges |
|
Confirm Password |
Confirm the Password by retyping it here. |
|
Listener Port |
To collect metrics from the target server, the eG agent should be configured to use JMX to connect to the JRE used by the target server and pull out the performance metrics. By default, JMX support is enabled for the JRE used by the target server. The JMX connector listens on port 9736, by default. Therefore, type 9736 as the Listener Port. However, if the host is configured with multiple sever instances, then you should specify the port number at which the JMX listens in your environment. Ensure that you specify the same port that you configured while creating the listener (if required) using the JEUS WebAdmin Console. To know the details on the listener port, refer to Enabling JMX Support for the JEUS Web Application Server |
|
Export name |
The export name is the reference name of the RMI connector that is to be used as a JMX connector. The procedure to obtain the export name is detailed inEnabling JMX Support for the JEUS Web Application Server |
|
Server name |
Provide the name of the sever instance that is being monitored in the Server Name text box. Also, ensure that the JVM monitoring is enabled for the target server. To obtain the name of the server instance, refer to Enabling JMX Support for the JEUS Web Application Server |
|
Detailed Diagnosis |
To make diagnosis more efficient and accurate, the eG Enterprise embeds an optional detailed diagnostic capability. With this capability, the eG agents can be configured to run detailed, more elaborate tests as and when specific problems are detected. To enable the detailed diagnosis capability of this test for a particular server, choose the On option. To disable the capability, click on the Off option. The option to selectively enable/disable the detailed diagnosis capability will be available only if the following conditions are fulfilled:
|
| Measurement | Description | Measurement Unit | Interpretation | ||||||
|---|---|---|---|---|---|---|---|---|---|
|
Is running? |
Indicates whether/not this server instance is currently running. |
|
The values reported by this measure and its numeric equivalents are mentioned in the table below:
Note: By default, this measure reports the current status of each server instance. The graph of this measure however, is represented using the numeric equivalents only - 0 or 1. The detailed diagnosis of this measure reveals the PID and name of the server instance, the name of the cluster (if the server instance is a member of a cluster), the time stamp at which the server was started, the port at which the server instance is listening, and the engines that are currently running on the server instance. |
||||||
|
Need to restart? |
Indicates whether/not this server instance needs to be restarted. |
|
The values reported by this measure and its numeric equivalents are mentioned in the table below:
Note: By default, this measure reports whether the server instance needs to be restarted or not. The graph of this measure however, is represented using the numeric equivalents only - 0 or 1. |
To identify the details on the server instances in your environment, use the detailed diagnosis of the Is running? measure.
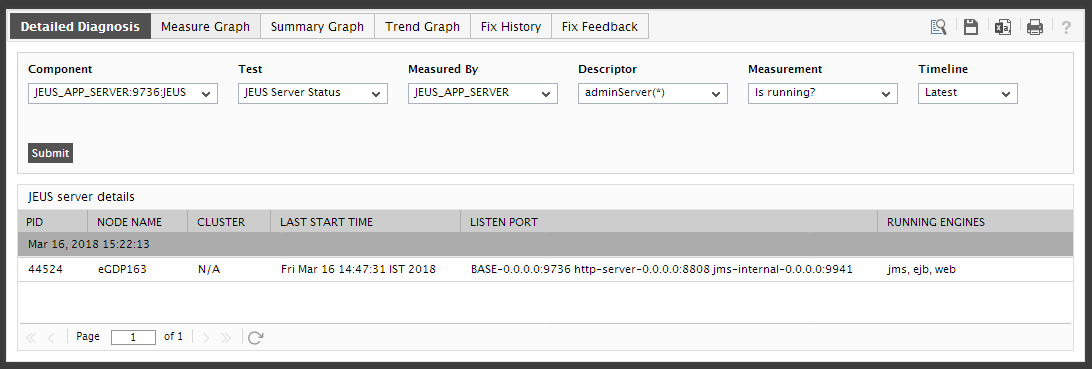
Figure 1 : The detailed diagnosis of Is running? measure