How Does eG Enterprise Monitor Kong API Gateway?
eG Enterprise can monitor Kong API Gateway in an agent-based or an agentless manner. In case of the agentless approach, the remote agent used to monitor the Kong API Gateway should be deployed on a remote host in the environment.
Regardless of the approach (agent-based or agentless), the eG Agent connects to the Kong Admin API and uses API keys to pull metrics.
Prerequisites for monitoring Kong API Gateway
Kong API Gateway is monitored using one of the Kong plugins Prometheus. Prometheus is an open source system monitor toolkit built at SoundCloud that is now widely adopted. StatsD is a simple daemon to aggregate and summarize application metrics. Prometheus provides a StatsD exporter to collect metrics that are sent in StatsD format. This enables Prometheus to pull metrics directly from the gateway or using a StatsD exporter in between to offload some work from the gateway.
The Prometheus plugin is used to collect gateway request metrics and expose them through the Kong Admin API. The Prometheus plugin provides key metrics such as:
-
Latency
-
Status codes
-
Bandwidth
eG Enterprise monitors these metrics once the Prometheus plugin is enabled in the Kong API Gateway. Before setting up the monitoring of Kong API Gateway, the Prometheus plugin has to be installed and configured on the same servers as the Kong. This is done by logging into Kong Manager. Go through the steps listed below to setup Kong API monitoring:
Enable the Prometheus plugin
Follow the steps below to find, install and set up the Prometheus plugin in the target Kong environment:
-
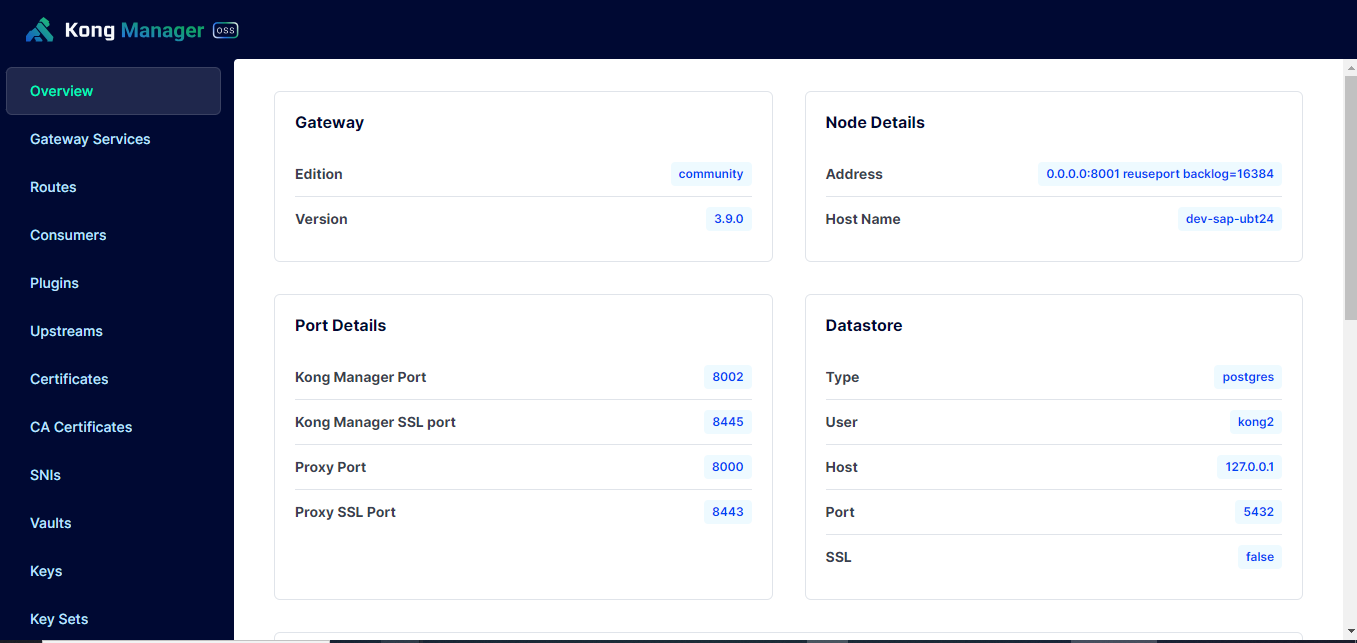
Login to Kong Manager using the admin credentials provided by Kong. Refer to Figure 1.
-
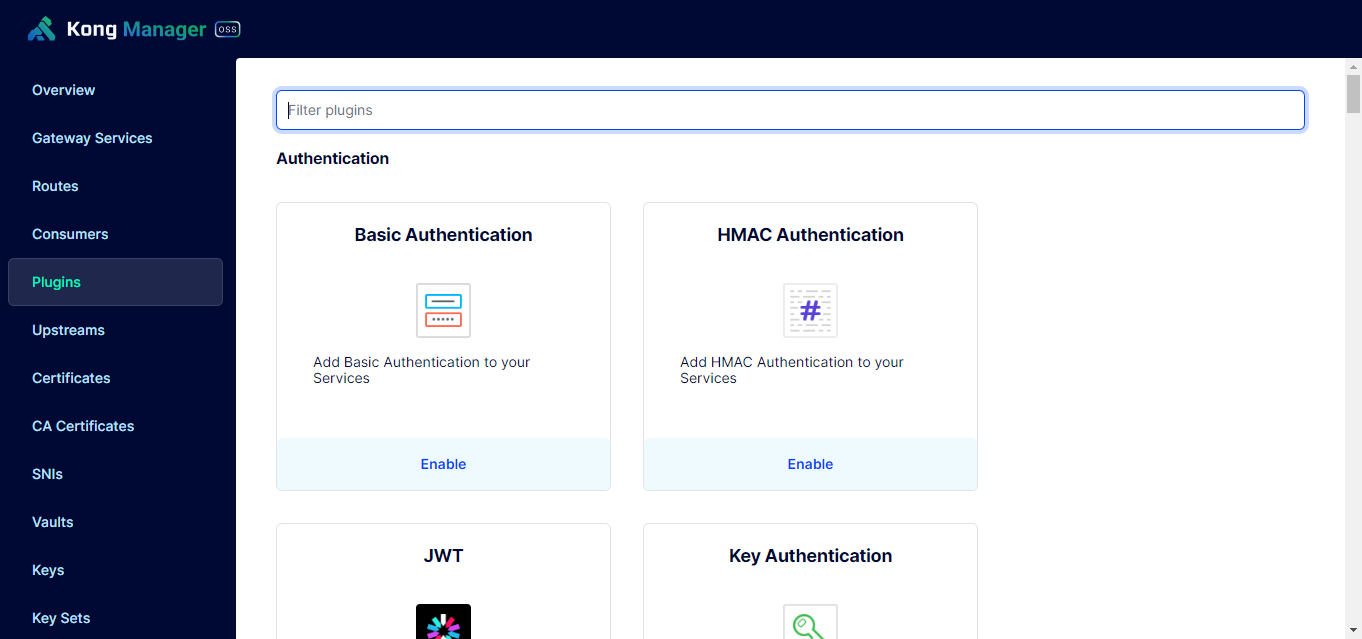
Go to Plugins section by navigating through the navigation menu on the left side of the screen as shown in Figure 2.
-
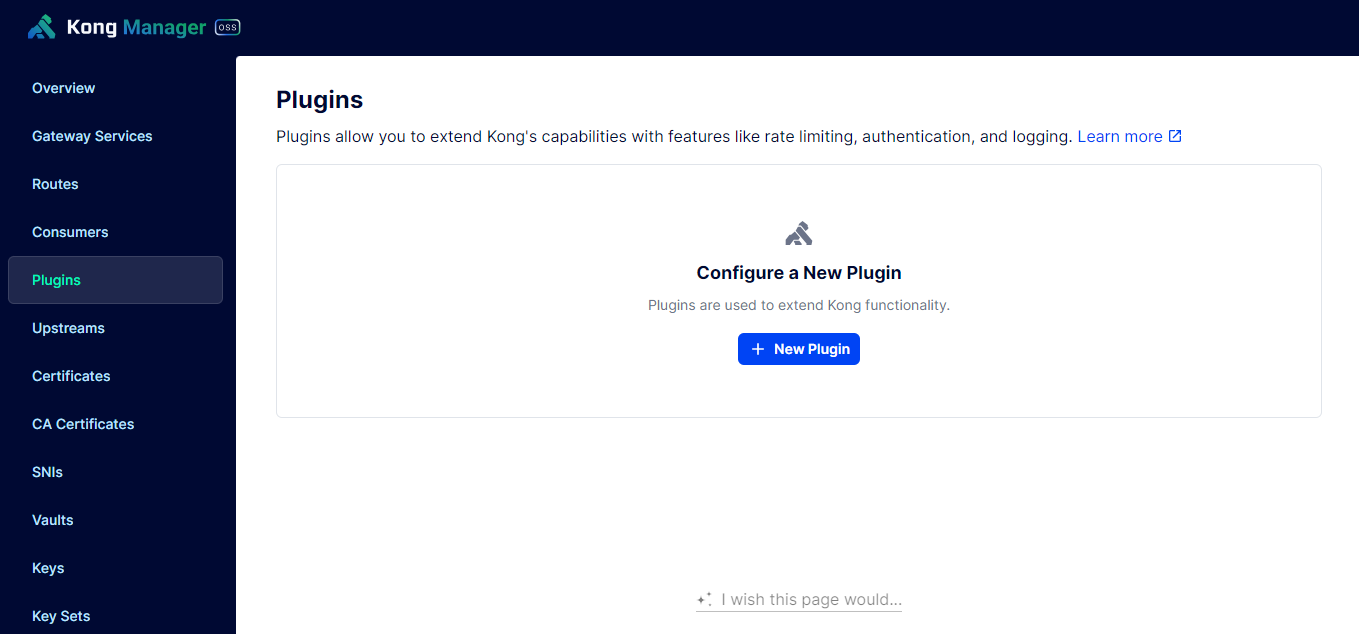
Click on New Plugin as shown in Figure 3.
-
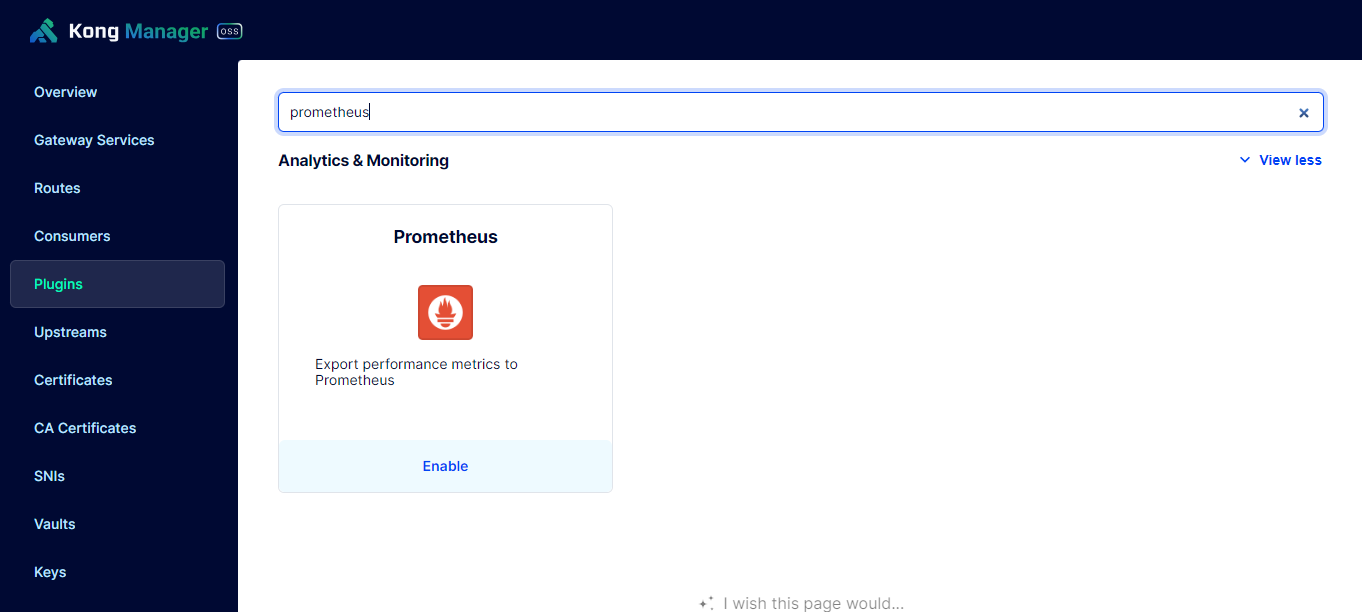
Type the name 'Prometheus' in the search box and click configure as shown in Figure 4.
-
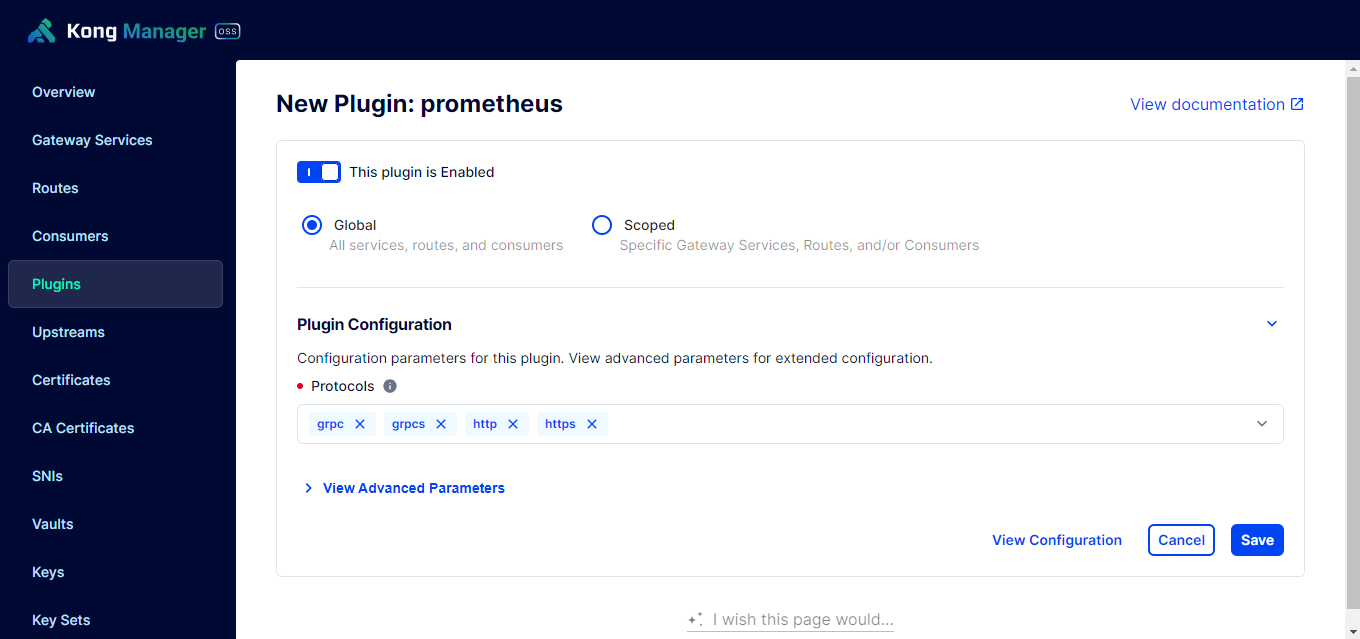
You can choose to enable the plugin globally for all services in a workspace or apply it to specific services or routes. For general monitoring, enabling it globally is often preferred.
-
Configure specific settings within the plugin, such as enabling per-consumer metrics, status code metrics, latency metrics, bandwidth metrics, or upstream health metrics, as needed for your monitoring requirements.
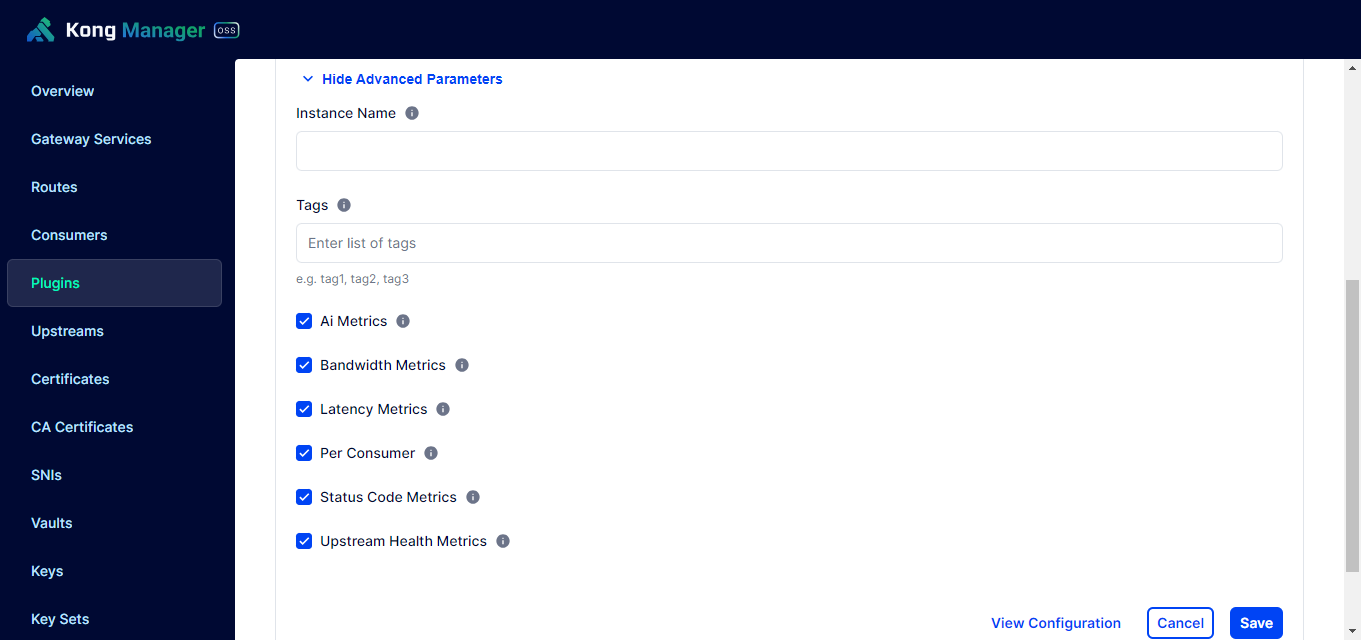
Figure 6 : Plugin configuration
-
Click Save button to enable the plugin.
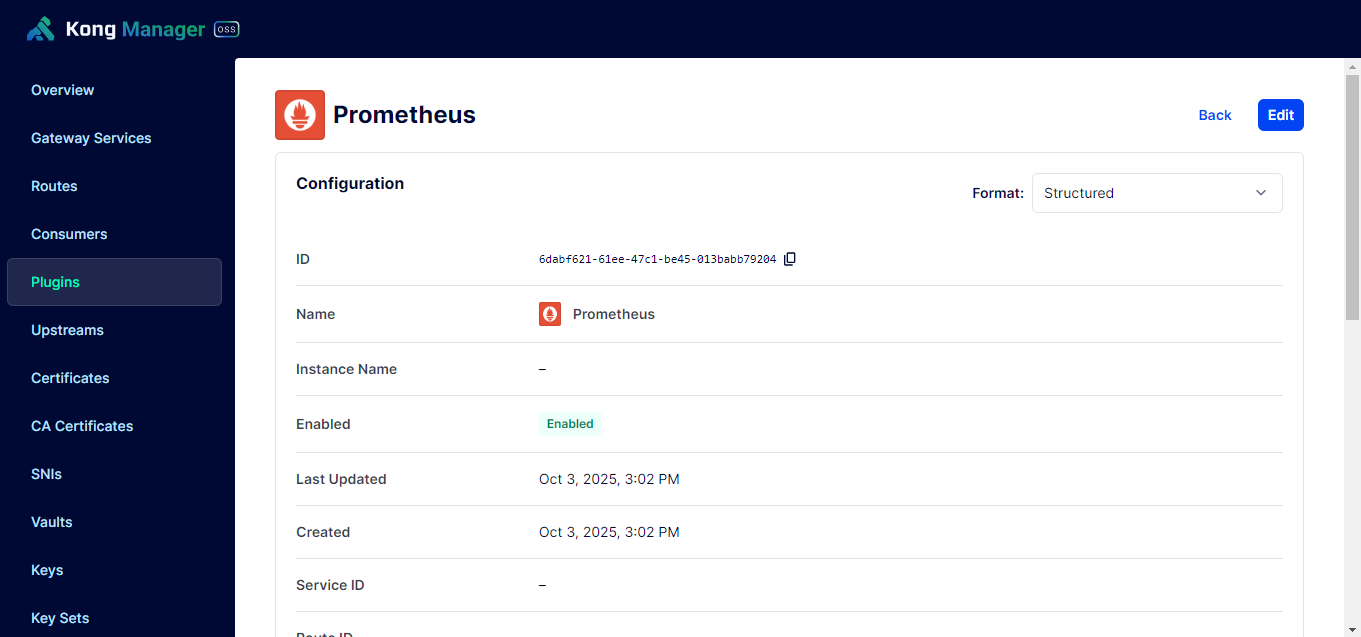
Figure 7 : Created and enabled the plugin
Configure the Prometheus plugin to scrape Kong metrics
-
Ensure your Kong Gateway is configured to expose the Prometheus endpoint. This usually involves setting status_listen in your kong.conf or environment variables to a specific address and port (e.g., 0.0.0.0:8100).
-
Add a job to your Prometheus configuration (prometheus.yml) to scrape metrics from Kong. This job will define the target endpoints where Prometheus can find the metrics.
-
Restart your Prometheus server to apply the new configuration.
Enabling eG Enterprise to pull metrics from Prometheus
-
The Kong Admin API IP and port must be reachable when configuring the component in agentless mode.
-
Ensure that the configured IP and port are correct.
-
If the Kong API Gateway uses the HTTPS protocol, set the SSL ENABLED test parameter to Yes. By default, this parameter is set to No.