K8s Cluster Nodes Test
A node is a worker machine in Kubernetes. A node may be a VM or physical machine, depending on the cluster. Each node contains the services necessary to run pods and is managed by the master components. The services on a node include the container runtime, kubelet and kube-proxy.
A node's status contains information such as the addresses (hostname, external IP address, internal IP address of the node), conditions describing the status of running nodes, the total resource capacity of the node and the usable (allocatable) capacity, and general information pertaining to the node (eg., kernel version, Kubernetes version etc.).
Nodes are automatically managed by the Node controller. If a node is unreachable beyond a configured duration, then the node controller automatically deletes all the Pods on that node. However, sometimes, manual administration/management of nodes may become necessary. For instance, administrators may have to manually delete unreachable node objects, if the node controller is unable to do so. Likewise, if a node is to be rebooted, then the administrator will have to manually mark that node as "unschedulable", so that new Pods do not get scheduled to that node.
While the Node controller manages the node 'condition', the Kubernetes scheduler manages Pod placements by automatically comparing the resource requirement of the containers in the Pods with the total and allocatable resource capacity of the nodes, and scheduling Pods on those nodes that fit their resource profile. Sometimes, a node may run Pods that oversubscribe to the node's resources - i.e., the sum of limits of the containers on the node may exceed the total resource capacity of the node. In an overcommitted environment, it is possible that the Pods on the node will attempt to use more compute resource than is available at any given point in time. If this happens, it can degrade the performance of containerized applications, as you may have a single Pod hogging the node's resources! Administrators may hence want to be promptly alerted to a resource overcommitment, so they can quickly identify which Pod is guilty of overcommitment and determine how resource allocations and usage priorities can be tweaked to ensure performance does not suffer! Additionally, administrators may also want to track resource usage across containers on a node, so they can proactively isolate a potential resource contention and instantly initiate pre-emptive action. The Kube Cluster Nodes test does all this and more!
The test auto-discovers the nodes in a Kubernetes/OpenShift cluster and clearly distinguishes between the master nodes and the workers. The test then monitors the condition of each node and points administrators to those nodes whose condition is 'unhealthy' or have been marked as 'unschedulable'. Additionally, the test reports the total CPU and memory capacity of every node, tracks the sum of resource requests/limits of the containers on each node, and accurately pinpoints those nodes where containers have oversubscribed to the node's capacity. Detailed diagnostics of the test lead administrators to the exact Pods that have oversubscribed to the node's resources. With the help of this information, administrators may decide to resize containers or reset resource usage priorities of containers, so that cluster performance is not compromised. Furthermore, the test reveals the percentage of a node's resources that are being utilized by the containers, thereby warning administrators of a probable contention for resources on a node.
Note:
This test collects metrics from an endpoint provided by a Metrics Server. This means, for this test to run, a Metrics Server needs to be installed in the cluster. Metrics Server is a cluster-wide aggregator of resource usage data. By default, it is deployed in clusters created by kube-up.sh script as a Deployment object. If you use a different Kubernetes setup mechanism, you can deploy it using the provided deployment components.yaml file. To know how to use the yaml file to install the Metrics Server, follow the steps detailed in the
Target of the test : A Kubernetes/OpenShift Cluster
Agent deploying the test : A remote agent
Outputs of the test : One set of results for each node in the Kubernetes/OpenShift cluster being monitored
| Parameter | Description |
|---|---|
|
Test Period |
How often should the test be executed. |
|
Host |
The IP address of the host for which this test is to be configured. |
|
Port |
Specify the port at which the specified Host listens. By default, this is 6443. |
|
Load Balancer / Master Node IP |
To run this test and report metrics, the eG agent needs to connect to the Kubernetes API on the master node and run API commands. To enable this connection, the eG agent has to be configured with either of the following:
By default, this parameter will display the Load Balancer / Master Node IP that you configured when manually adding the Kubernetes/OpenShift cluster for monitoring, using the Kubernetes Cluster Preferences page in the eG admin interface (see Figure 3). The steps for managing the cluster using the eG admin interface are discussed elaborately in How to Monitor the Kubernetes/OpenShift Cluster Using eG Enterprise? Whenever the eG agent runs this test, it uses the IP address that is displayed (by default) against this parameter to connect to the Kubernetes API. If there is any change in this IP address at a later point in time, then make sure that you update this parameter with it, by overriding its default setting. |
|
K8s Cluster API Prefix |
|
|
SSL |
By default, the Kubernetes cluster is SSL-enabled. This is why, the eG agent, by default, connects to the Kubernetes API via an HTTPS connection. Accordingly, this flag is set to Yes by default. If the cluster is not SSL-enabled in your environment, then set this flag to No. |
|
Authentication Token |
The eG agent requires an authentication bearer token to access the Kubernetes API, run API commands on the cluster, and pull metrics of interest. The steps for generating this token have been detailed in How Does eG Enterprise Monitor a Kubernetes/OpenShift Cluster?
Typically, once you generate the token, you can associate that token with the target Kubernetes/OpenShift cluster, when manually adding that cluster for monitoring using the eG admin interface. The steps for managing the cluster using the eG admin interface are discussed elaborately in How to Monitor the Kubernetes/OpenShift Cluster Using eG Enterprise? By default, this parameter will display the Authentication Token that you provided in the Kubernetes Cluster Preferences page of the eG admin interface, when manually adding the cluster for monitoring (see Figure 3). Whenever the eG agent runs this test, it uses the token that is displayed (by default) against this parameter for accessing the API and pulling metrics. If for any reason, you generate a new authentication token for the target cluster at a later point in time, then make sure you update this parameter with the change. For that, copy the new token and paste it against this parameter. |
|
Proxy Host |
If the eG agent connects to the Kubernetes API on the master node via a proxy server, then provide the IP address of the proxy server here. If no proxy is used, then the default setting -none - of this parameter, need not be changed, |
|
Proxy Port |
If the eG agent connects to the Kubernetes API on the master node via a proxy server, then provide the port number at which that proxy server listens here. If no proxy is used, then the default setting -none - of this parameter, need not be changed, |
|
Proxy Username, Proxy Password, Confirm Password |
These parameters are applicable only if the eG agent uses a proxy server to connect to the Kubernetes/OpenShift cluster, and that proxy server requires authentication. In this case, provide a valid user name and password against the Proxy Username and Proxy Password parameters, respectively. Then, confirm the password by retyping it in the Confirm Password text box. If no proxy server is used, or if the proxy server used does not require authentication, then the default setting - none - of these parameters, need not be changed. |
|
DD Frequency |
Refers to the frequency with which detailed diagnosis measures are to be generated for this test. The default is 3:1. This indicates that, by default, detailed measures will be generated every third time this test runs, and also every time the test detects a problem. You can modify this frequency, if you so desire. Also, if you intend to disable the detailed diagnosis capability for this test, you can do so by specifying none against DD frequency. |
|
Detailed Diagnosis |
To make diagnosis more efficient and accurate, the eG Enterprise embeds an optional detailed diagnostic capability. With this capability, the eG agents can be configured to run detailed, more elaborate tests as and when specific problems are detected. To enable the detailed diagnosis capability of this test for a particular server, choose the On option. To disable the capability, click on the Off option. The option to selectively enable/disable the detailed diagnosis capability will be available only if the following conditions are fulfilled:
|
| Measurement | Description | Measurement Unit | Interpretation | ||||||||
|---|---|---|---|---|---|---|---|---|---|---|---|
|
Status |
Indicates whether/not this node is running. |
|
The values that this measure reports and their corresponding numeric values are detailed in the table below:
Note: By default, this test reports the Measure Values listed in the table above to indicate the state of a node. In the graph of this measure however, the state is indicated using the numeric equivalents only. In the event that this measure reports the value Not running or Unknown for a node, then you can use the detailed diagnosis of this measure to know the reason for the abnormal status. |
||||||||
|
Is node unschedulable? |
Indicates whether/not this node is unschedulable. |
|
By default, healthy nodes with a Ready status are marked as schedulable, meaning that new pods are allowed for placement on the node. Manually marking a node as unschedulable blocks any new pods from being scheduled on the node. Typically, nodes from which Pods need to be migrated/evacuated are candidates for being marked as 'unschedulable' status. Sometimes, nodes that have been unhealthy for a long time are also set as 'unschedulable'. You may want to check the Kubelet job number on such a node. There is a chance that the Kubelet has died in a node and is unable to schedule pods. The values that this measure reports and their corresponding numeric values are detailed in the table below:
Note: By default, this test reports the Measure Values listed in the table above to indicate whether/not a node has been manually set as unschedulable. In the graph of this measure however, the same is indicated using the numeric equivalents only. |
||||||||
|
Maintenance mode |
Indicates whether/not this node is in the maintenance mode. |
|
By putting a node into maintenance mode, all existing workloads will be restarted on other nodes to ensure availability, and no new workloads will be started on the node. Maintenance mode allows you to perform operations such as security updates or rebooting machines without the loss of availability. The values that this measure reports and their corresponding numeric values are detailed in the table below:
Note: By default, this test reports the Measure Values listed in the table above to indicate whether/not a node is in the maintenance mode. In the graph of this measure however, the same is indicated using the numeric equivalents only. |
||||||||
|
Time since node creation |
Indicates how old this node is. |
|
The value of this measure is expressed in number of days, hours, and minutes. Use the detailed diagnosis of this measure to know more about a particular node. |
||||||||
|
Is the network of the node unavailable? |
Indicates whether/not the network of this node is correctly configured. |
|
The values that this measure reports and their corresponding numeric values are detailed in the table below:
Note: By default, this test reports the Measure Values listed in the table above to indicate the availability of a node's network. In the graph of this measure however, the same is indicated using the numeric equivalents only. If this measure reports the value Yes for a node - i.e., if the network of a node is indeed unavailable - then you can use the detailed diagnosis of this measure to figure out the reason for the unavailability. |
||||||||
|
Is the node out of disk? |
Indicates whether/not there is insufficient free disk space on this node for adding new Pods. |
|
The values that this measure reports and their corresponding numeric values are detailed in the table below:
Note: By default, this test reports the Measure Values listed in the table above to indicate whether/not a node has run out of disk space. In the graph of this measure however, the same is indicated using the numeric equivalents only. If this measure reports the value Yes for a node - i.e., if a node has indeed run out of free disk space - then you can use the detailed diagnosis of this measure to figure out the reason for the anomaly. |
||||||||
|
Is the node under memory pressure? |
Indicates whether/not this node is running low on memory. |
|
The values that this measure reports and their corresponding numeric values are detailed in the table below:
Note: By default, this test reports the Measure Values listed in the table above to indicate whether/not a node has sufficient memory. In the graph of this measure however, the same is indicated using the numeric equivalents only. If this measure reports the value Yes for a node - i.e., if a node is running out of memory - then you can use the detailed diagnosis of this measure to figure out the reason for the anomaly. |
||||||||
|
Does the node have disk pressure? |
Indicates whether/not this node's disk capacity is low. |
|
The values that this measure reports and their corresponding numeric values are detailed in the table below:
Note: By default, this test reports the Measure Values listed in the table above to indicate whether/not a node is low on disk capacity. In the graph of this measure however, the same is indicated using the numeric equivalents only. If this measure reports the value Yes for a node - i.e., if a node is low on disk capacity - then you can use the detailed diagnosis of this measure to figure out the reason for the anomaly. |
||||||||
|
Is the node under PID pressure? |
Indicates whether/not too many processes are running on the node. |
|
The values that this measure reports and their corresponding numeric values are detailed in the table below:
Note: By default, this test reports the Measure Values listed in the table above to indicate whether/not a node is under PID pressure. In the graph of this measure however, the same is indicated using the numeric equivalents only. If this measure reports the value Yes for a node - i.e., if too many processes are running on a node - then you can use the detailed diagnosis of this measure to figure out the reason for the anomaly. |
||||||||
|
Is the node ready? |
Indicates whether/not a node is healthy and ready to accept Pods. |
|
This measure reports the value Yes, if a node is healthy and is ready to accept Pods. The value No is reported if a node is not healthy and is not accepting Pods. The value Unknown is reported if the node controller has not heard from the node in the last node-monitor-grace-period (default is 40 seconds). The values that this measure reports and their corresponding numeric values are detailed in the table below:
Note: By default, this test reports the Measure Values listed in the table above to indicate whether/not a node is ready. In the graph of this measure however, the same is indicated using the numeric equivalents only. If this measure reports the value No or Unknown for a node, then you can use the detailed diagnosis of this measure to figure out the reason for the anomaly. |
||||||||
|
Total CPUs |
Indicates the total CPU capacity of this node, in terms of the number of CPU cores it supports. |
Number |
|
||||||||
|
Memory capacity |
Indicates the total memory capacity of this node. |
GB |
|
||||||||
|
Pods capacity |
Indicates the maximum number of Pods that can be scheduled on this node. |
Number |
|
||||||||
|
Running pods |
Indicates the number of Pods currently running on this node. |
Number |
If the value of this measure for a node is equal to or is growing closer to the value of the Pods capacity measure, it indicates that node has or is about to exhaust its Pod capacity. You can use the detailed diagnosis of this measure to know which Pods are running on the node and which containers are running within each Pod. |
||||||||
|
Pods utilization |
Indicates the percentage of the Pod capacity of this node that is currently being utilized. |
Percent |
The formula used to compute the value of this measure is as follows: (Running pods/Pods capacity)*100 A value equal to or close to 100% indicates that the node has or is about to exhaust its Pod capacity. In such circumstances, you may want to consider increasing the Pod capacity of the node or freeing the node of unused/inactive Pods. |
||||||||
|
Total containers |
Indicates the total number of containers running on this node. |
Number |
To know which containers are running on the node, use the detailed diagnosis of this measure. |
||||||||
|
CPU capacity |
Indicates the CPU capacity of this node. |
Millicpu |
|
||||||||
|
CPU limits |
Indicates the total amount of CPU resources that containers on this node are allowed to use. |
Millicpu |
The value of this measure is the sum of CPU limits set for the individual containers across all the Pods running on this node. If the value of this measure is greater than the value of the CPU capacity measure, it could mean that one/more Pods have oversubscribed to the node's CPU capacity. |
||||||||
|
CPU requests |
Indicates the minimum amount of CPU resources guaranteed to all the containers on this node. |
Millicpu |
The value of this measure is the sum of CPU requests configured for the individual containers across all the Pods running on this node. |
||||||||
|
Memory limits |
Indicates the total amount of memory resources that containers on this node are allowed to use. |
GB |
The value of this measure is the sum of memory limits set for the individual containers across all the Pods running on this node. If the value of this measure is greater than the value of the Memory capacity measure, it could mean that one/more Pods have oversubscribed to the node's memory capacity. |
||||||||
|
Memory requests |
Indicates the minimum amount of memory resources guaranteed to all the containers on this node. |
GB |
The value of this measure is the sum of memory requests configured for the individual containers across all the Pods running on this node. |
||||||||
|
CPU limits allocation |
Indicates what percentage of the capacity of this node is allocated as CPU limits to containers. In other words, this is the percentage of a node's CPU capacity that the containers on that node are allowed to use. |
Percent |
The formula used for computing this measure is as follows: (CPU limits/CPU capacity)*100 If the value of this measure exceeds 100%, it means that the node is overcommitted. In other words, it means that the Pods on the node have been allowed to use more resources than the node's capacity. In such a situation, you may want to look up the detailed diagnostics of this measure to identify the Pods that are contributing to the overcommitment. |
||||||||
|
Memory limits allocation |
Indicates what percentage of the memory capacity of this node is allocated as memory limits to containers. In other words, this is the percentage of a node's memory capacity that the containers on that node are allowed to use. |
Percent |
The formula used for computing this measure is as follows: (Memory limits/Memory capacity)*100 If the value of this measure exceeds 100%, it means that the node is overcommitted. In other words, it means that the Pods on the node have been allowed to use more resources than the node's capacity. In such a situation, you may want to look up the detailed diagnostics of this measure to identify the Pods that are contributing to the overcommitment. |
||||||||
|
CPU requests allocation |
Indicates what percentage of the total CPU capacity of this node is set as CPU requests for the containers on that node. In other words, this is the percentage of a node's CPU capacity that the containers on that node are guaranteed to receive. |
Percent |
The formula used for computing this measure is as follows: (CPU requests/CPU capacity)*100 Compare the value of this measure across nodes to know which node has been guaranteed the maximum CPU resources. You can even use the detailed diagnosis of this measure to identify the specific Pods in that node with the maximum CPU requests. |
||||||||
|
Memory requests allocation |
Indicates what percentage of the total memory capacity of this node is set as memory requests for the containers on that node. In other words, this is the percentage of a node's memory capacity that the containers on that node are guaranteed to receive. |
Percent |
The formula used for computing this measure is as follows: (Memory requests/Memory capacity)*100 Compare the value of this measure across nodes to know which node has been guaranteed the maximum memory resources. You can even use the detailed diagnosis of this measure to identify the specific Pods in that node with the maximum memory requests. |
||||||||
|
CPU allocation overcommited |
Indicates whether/not this node is overcommitted in terms of CPU resources. |
|
If the CPU limits allocation measure reports a value greater than 100% for a node, then this measure will report the value True for that node. This implies that the node's CPU resources are overcommitted. On the other hand, if the CPU limits allocation measure of a node reports a value lesser than 100%, then this measure will report the value False for that node. This implies that the node's CPU resources are not overcommitted. The values that this measure reports and their corresponding numeric values are detailed in the table below:
Note: By default, this test reports the Measure Values listed in the table above to indicate whether/not a node's CPU resources are overcommitted. In the graph of this measure however, the same is indicated using the numeric equivalents only. In an overcommitted environment, it is possible that the Pods on the node will attempt to use more compute resource than is available at any given point in time. To know which Pods are using more resources than the node's capacity, use the detailed diagnosis of this measure. When an overcommitment occurs, the node must give priority to one Pod over another. The facility used to make this decision is referred to as a Quality of Service (QoS) Class. By assigning a QOS class to each container, administrators can make sure that the performance of mission-critical applications does not suffer owing to insufficient resources. For each compute resource, a container is divided into one of three QoS classes with decreasing order of priority:
Administrators can also control the level of overcommit and manage container density on nodes. For this, masters can be configured to override the ratio between request and limit set on developer containers. In conjunction with a per-project LimitRange specifying limits and defaults, this adjusts the container limit and request to achieve the desired level of overcommit. |
||||||||
|
Memory allocation overcommitted |
Indicates whether/not this node is overcommitted in terms of memory resources. |
|
If the Memory limits allocation measure reports a value greater than 100% for a node, then this measure will report the value True for that node. This implies that the node's memory resources are overcommitted. On the other hand, if the Memory limits allocation measure of a node reports a value lesser than 100%, then this measure will report the value False for that node. This implies that the node's memory resources are not overcommitted. The values that this measure reports and their corresponding numeric values are detailed in the table below:
Note: By default, this test reports the Measure Values listed in the table above to indicate whether/not a node's memory resources are overcommitted. In the graph of this measure however, the same is indicated using the numeric equivalents only. In an overcommitted environment, it is possible that the Pods on the node will attempt to use more compute resource than is available at any given point in time. To know which Pods may attempt to use more resources than the node's capacity, use the detailed diagnosis of this measure. When an overcommitment occurs, the node must give priority to one pod over another. The facility used to make this decision is referred to as a Quality of Service (QoS) Class. By assigning a QOS class to each container, administrators can make sure that the performance of mission-critical applications does not suffer owing to insufficient resources. For each compute resource, a container is divided into one of three QoS classes with decreasing order of priority:
Administrators can also control the level of overcommit and manage container density on nodes. For this, masters can be configured to override the ratio between request and limit set on developer containers. In conjunction with a per-project LimitRange specifying limits and defaults, this adjusts the container limit and request to achieve the desired level of overcommit. |
||||||||
|
Total images |
Indicates the total number of images on this node. |
Number |
Use the detailed diagnosis of this measure to know which images are on the node. |
||||||||
|
Used images |
Indicates the total number of images currently used by the containers on this node. |
Number |
To view the used images, use the detailed diagnosis of this measure. |
||||||||
|
Not used images |
Indicates the number of images still to be used by the containers on this node. |
Number |
To view the unused images, use the detailed diagnosis of this measure. |
||||||||
|
Images size |
Indicates the total size of images on this node. |
GB |
|
||||||||
|
Node type |
Indicates the node type. |
|
A node can be a Master node or a Worker node in a cluster. A cluster has at least one worker node and at least one master node. The worker node(s) host the pods that are the components of the application. The master node(s) manages the worker nodes and the pods in the cluster. Multiple master nodes are used to provide a cluster with failover and high availability. If a node is the master node in a cluster, then this measure will report the value Master. For a worker node, this measure will report the value Worker. The numeric values that correspond to these measure values are as follows:
Note: By default, this test reports the Measure Values listed in the table above to indicate the node type. In the graph of this measure however, the same is indicated using the numeric equivalents only. |
||||||||
|
CPU usage |
Indicates the amount of CPU resources used by this node. |
Millicpu |
Ideally, the value of this measure should be much lesser than the value of the CPU capacity measure. If the value of this measure is equal to or is rapidly approaching the value of the CPU capacity measure, it means that the node is running out of CPU resources. |
||||||||
|
CPU utilization |
Indicates the percentage of CPU resources utilized by this node. |
Percent |
A value close to 100% is indicative of excessive CPU usage by a node, and hints at a potential CPU contention on the node. A value greater than 100% implies that one/more Pods have probably over-subscribed to the node's capacity. To know which Pod on the node is contributing to the contention/overcommitment, use the detailed diagnosis of this measure. |
||||||||
|
Memory usage |
Indicates the amount of memory resources used by this node. |
Millicpu |
Ideally, the value of this measure should be much lesser than the value of the Memory capacity measure. If the value of this measure is equal to or is rapidly approaching the value of the Memory capacity measure, it means that the node is running out of memory resources. |
||||||||
|
Memory utilization |
Indicates the percentage of memory resources utilized by this node. |
Percent |
A value close to 100% is indicative of excessive memory usage by a node, and signals a potential memory contention on the node. A value greater than 100% implies that one/more Pods have probably over-subscribed to the node's capacity. To know which Pod on the node is contributing to the contention/overcommitment, use the detailed diagnosis of this measure. |
||||||||
|
Network data received |
Indicates the rate at which data was received by this node over the network. |
KBps |
Compare the value of this measure across nodes to identify the node that received maximum amount of data over the network per second. The detailed diagnosis of this measure lists the name of the Namespace in the node, the name of the Pod belonging to the Namespace and the rate at which data was received over the network by the Pod. |
||||||||
|
Network data transmitted |
Indicates the rate at which data was transmitted by this node through the network. |
KBps |
Compare the value of this measure across nodes to identify the node that transmitted maximum amount of data through the network per second. The detailed diagnosis of this measure lists the name of the Namespace in the node, the name of the Pod belonging to the Namespace and the rate at which data was received over the network by the Pod. |
||||||||
|
CPU throttled as percent of Node CPU configured |
Indicates the percentage of the node's total CPU capacity that has been throttled due to CPU limits set on the conatiners within this node. |
Percent |
This measure helps to identify whether nodes are experiencing CPU contention. |
||||||||
|
CPU slack |
Indicates the total amount of CPU resources that are available but not currently requested or used by the pods running on this node. |
Millicpu |
This measure points you to the amount of CPU available for new workloads or to handle scaling without exceeding the node’s capacity. |
||||||||
|
Memory slack |
Indicates the amount of memory available in this node but not yet requested by any pods. |
GB |
This measure shows how much memory is unused and available for allocation to new pods or to handle scaling. |
||||||||
|
CPU throttled |
Indicates the amount of CPU time that was throttled on this node due to containers exceeding their configured CPU limits. |
Millicpu |
This measure helps to identify if the containers are hitting CPU limits and thereby helps for resource tuning. |
||||||||
|
Total capacity |
Indicates the total disk space in this node. |
GB |
|
||||||||
|
Used space |
Indicates the amount of disk space used by this node. |
GB |
|
||||||||
|
Free space |
Indicates the amount of disk space unused by this node. |
GB |
|
||||||||
|
Percent usage |
Indicates the percentage of disk space used by this node. |
Percent |
|
||||||||
|
Data write rate to disk |
Indicates the amount of data written to the disk in this node. |
KB/Sec |
|
||||||||
|
Disk write rate |
Indicates the number of times the data is written to the disk in this node. |
Writes/Sec |
A dramatic increase in this value may be indicative of an I/O bottleneck.
|
||||||||
|
Disk read rate |
Indicates the number of times the data is read from the disk in this node. |
Reads/Sec |
|||||||||
|
Data read rate from disk |
Indicates the amount of data read from the disk in this node. |
KB/Sec |
|
The detailed diagnosis of the Running pods measure reveals which Pods are running on the node and which containers are running within each Pod.
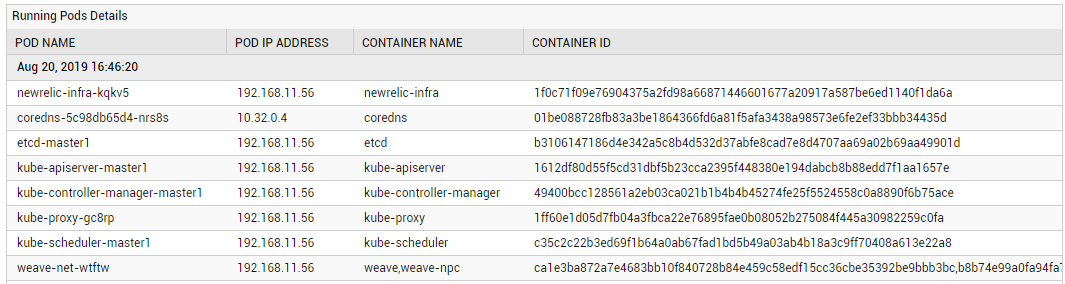
Figure 1 : The detailed diagnosis of the Running pods measure
The detailed diagnosis of the Total containers measure reveals the names of containers running on a node, the Pod to which each container belongs, and the namespace to which the Pod belongs.
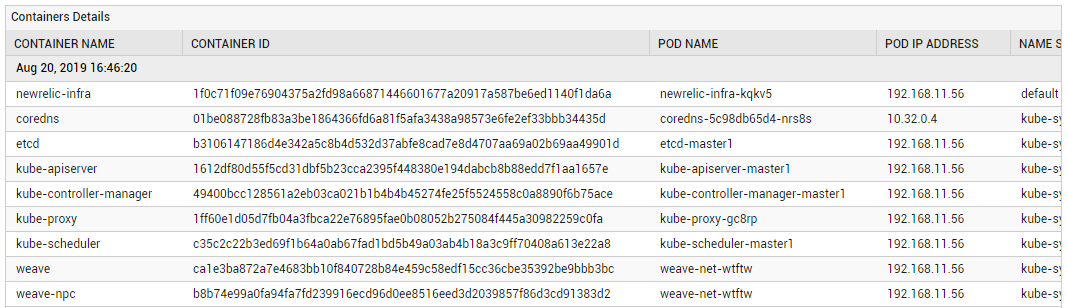
Figure 2 : The detailed diagnosis of the Total containers measure
If the CPU limits allocation measure reports a value over 100%, it indicates an overcommitment of CPU resources on the node. In such a situation, you can use the detailed diagnostics of this measure to identify the Pods that are contributing to the overcommitment.
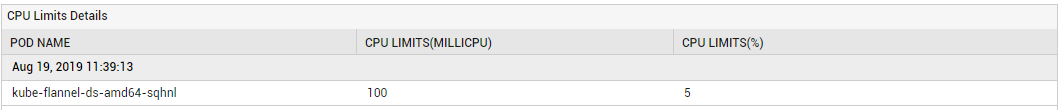
Figure 3 : The detailed diagnosis of the CPU limits allocation measure
Using the detailed diagnosis of the CPU requests allocation measure, you can quickly identify the specific Pods on the node with the maximum CPU requests. In the event of a CPU contention on the node, this information will lead you to the exact Pod that is hogging CPU resources.
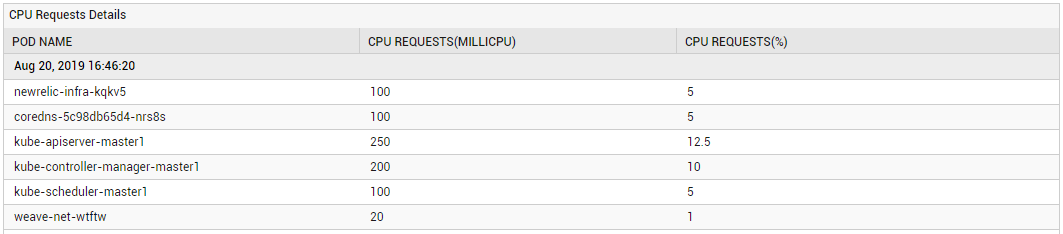
Figure 4 : The detailed diagnosis of the CPU requests allocation measure
If the Memory limits allocation measure reports a value over 100%, it indicates an overcommitment of memory resources on the node. In such a situation, you can use the detailed diagnostics of this measure to identify the Pods that are contributing to the overcommitment.
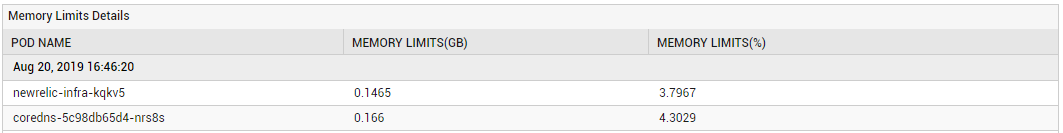
Figure 5 : The detailed diagnosis of the Memory limits allocation measure
Using the detailed diagnosis of the Memory requests allocation measure, you can quickly identify the specific Pods on the node with the maximum memory requests. In the event of a memory contention on the node, this information will lead you to the exact Pod that is hogging memory resources.
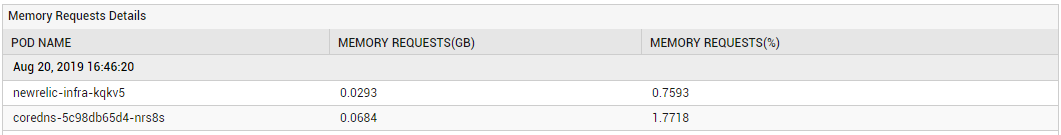
Figure 6 : The detailed diagnosis of the Memory requests allocation measure