Monitoring the Leostream Connection Broker
eG Enterprise prescribes a specialized Leostream CB monitoring model that provides 24 x 7 monitoring of the Connection Broker.
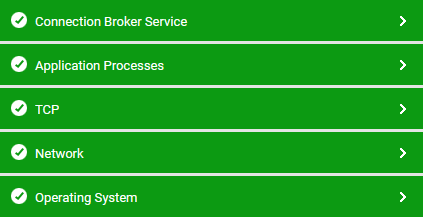
Figure 1 : Layer model of the Virtual Desktop Manager
Each layer of Figure 2 is mapped to a series of tests that report a wide variety of performance metrics. The Operating System layer monitors the CPU, memory, and disk resources used on the operating system that the Connection Broker is running on. The Network layer monitors connectivity and traffic to and from the Connection Broker system. TCP traffic activity is tracked by the TCP layer, and the status of the key Connection Broker processes (e.g., the web server, the application server, etc.) is tracked by the Application Processes layer. The metrics associated with each of these layers are dealt with extensively in the Unix and Windows Servers
The Connection Broker Service layer collects metrics specific to the Leostream Connection Broker. Using these metrics, administrators can find quick and easy answers to the following performance queries:
- Is the Connection Broker available? How quickly is it responding to requests?
- Is the web server component of the Connection Broker available?
- Are the internal and external databases of the Connection Broker available?
- Are the databases responding quickly to queries?
- Were any errors reported in the Connection Broker logs?
- What is the current status of each center from which the Connection Broker gathers desktops, physical machines, etc.?
- How many jobs are in the work queue? Are there too many pending jobs?
- Did any job abort suddenly?
- Are the Sun Ray servers connected to the Connection Broker active?
- How many VMs are registered with the Connection Broker? How many of these VMs are simultaneously active and how many VMs are available to handle new requests from users?