Monitoring the Maipu Router
By executing a couple of simple tests on the SNMP MIB exposed by the Maipu Router, the eG external agent performs 24 x 7 monitoring of the router, extracts critical performance data from the router, and reports the metrics so gathered to the eG manager. The eG manager in turn, maps these tests to the layers of the unique Maipu Router layer model (see Figure 1) that it prescribes for the Maipu Router, and displays the performance data in the eG monitor console.
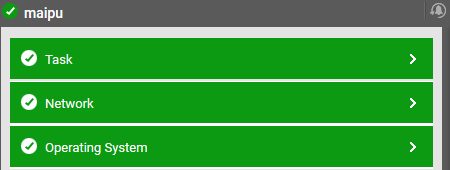
Figure 1 : The layer model of the Maipu Router
Every layer of Figure 1 is mapped to a variety of tests which connect to the SNMP MIB of the target router to collect critical statistics pertaining to its performance. The metrics reported by these tests enable administrators to answer the following questions:
- What is the current status of each task?
- What is the priority of each task?
- What is the current option used by each task?
- What percentage of CPU is utilized to perform each task?
- What is the total size of stack memory utilized by each task?
- How much of stack memory is available for use by each task?
- What percentage of stack memory was utilized by each task?
- What is the current status of the CPU?
- What is the utilization percentage of CPU?
- How much memory was allocated for the router?
- What is the amount of memory utilized by the router?
- What is the amount of memory that is still available for use by the router?
- What is the temperature of the CPU?
- What is the temperature of the motherboard?