Mailbox Databases Test
A mailbox database consists of one/more mailboxes. Very often, administrators may have to quickly identify which database has the maximum free space in it, which database is running out of space, and which mailbox has too many mailboxes already, so that they know where more mailboxes/users can be created and where no new mailboxes can be added. The Mailbox Databases test assists administrators in this exercise. This test auto-discovers the mailbox databases on the Exchange server. For each mailbox database so discovered, the test reports the current database size, the number of mailboxes in that database, and the mount status of the database. Using this information, administrators can accurately identify the database with the maximum space, the database with very few mailboxes, and that which is mounted and ready for use, so that they are able to determine where more mailboxes can be created.
Target of the test : A Microsoft Exchange 2013/2016 server
Agent deploying the test : An internal/remote agent
Outputs of the test : One set of results for each mailbox database on the Exchange 2013/2016 server
|
| Measurement | Description | Measurement Unit | Interpretation | ||||||
|---|---|---|---|---|---|---|---|---|---|
|
Database size: |
Indicates the current size of this mailbox database. |
MB |
Compare the value of this measure across databases to know which databases are of a very small size. Such databases are candidates for the inclusion of more mailboxes. To know the full path to the .edb file that corresponds to a mailbox database and the server on which it is mounted, use the detailed diagnosis of this measure. |
||||||
|
White space space: |
Indicates the size of the white space in this database. |
MB |
Whenever emails/mailboxes are deleted, or any other cleanup functionality takes place, database space is freed for use, The free space so created is called white space. The whitespace is eventually used by new data, so the mailbox database size does not grow until it has to because it has used the whitespace. Administrators can compare the value of this measure across databases to know which database has the maximum white space. When administrators plan to create more mailboxes, such databases can be considered for use first, before attempting to expand database space or delete mailboxes to make more space. |
||||||
|
Is mailbox database mounted?: |
Indicates the mount status of this database. |
|
The values that this measure can report and their corresponding numeric values are listed hereunder:
Note: By default, this measure reports one of the Measure Values listed in the table above. In the graph of this measure however, the mount status is indicated by the corresponding numeric equivalents only. |
||||||
|
Mailbox count: |
Indicates the number of mailboxes in this database. |
Number |
Compare the value of this measure across databases to know which database has the least number of mailboxes. This database can be configured with more mailboxes, if and when the need arises. Use the detailed diagnosis of this measure to know which mailboxes are stored in this database, the email ID of each mailbox, and which features – i.e., ActiveSync, OWA, POP3, IMAP4, MAPI, and OMA - are enabled for every mailbox and which ones are disabled. |
||||||
|
Is backup in progress? |
Indicates whether/not this database is in the process of being backed up. |
|
The values that this measure can report and their corresponding numeric values are listed hereunder:
Note: By default, this measure reports one of the Measure Values listed in the table above. In the graph of this measure however, the backup status is indicated by the corresponding numeric equivalents only. |
||||||
|
Replication type: |
Indicates the current replication status of this database. |
|
The values that this measure can report and their corresponding numeric values are listed hereunder:
Note: By default, this measure reports one of the Measure Values listed in the table above. In the graph of this measure however, the database replication status is indicated by the corresponding numeric equivalents only. |
Using the detailed diagnosis of the Database size measure you can know the the full path to the .edb file that corresponds to a mailbox database and the server on which it is mounted.
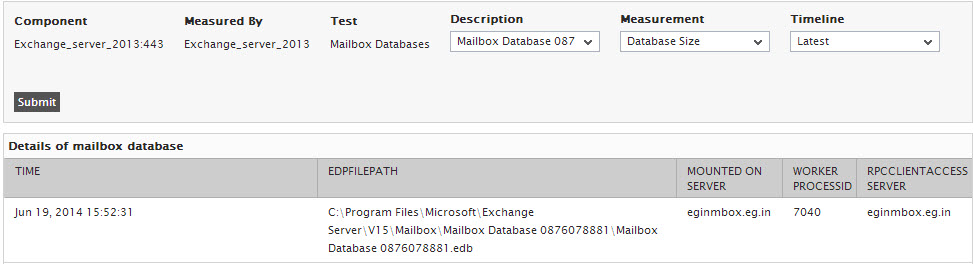
Figure 8 : Figure 1.7: The detailed diagnosis of the Database size measure