Critical or Slow Web Parts Test
A web site/web application on SharePoint typically constitutes numerous web pages. The performance of each of these pages is a key determinant of user experience with the web site/web application as a whole! Each web page in turn is made up of multiple web parts, So, when a web page slows down, more often than not, one/more web parts that constitute that web page will be responsible for the slowness! This is why, when users complain that a web site/web application is slow, administrators should first check whether/not the web parts used to build that web site/web application are taking too long to load, and if so, why. This is where the Critical or Slow Web Parts test helps!
For each web site, this test reports the time taken by the web parts in that site to load. In the event of undue delay in web part loading, the test also points administrators to the probable cause of the delay – is it because of processing delays in the web part? Is it because the web parts took too long to generate service calls? Or is it owing to inefficient queries to the backend database? Detailed diagnosis of the test also leads you to the precise service calls and queries that could have contributed to the slowness.
For this test to run and report metrics, the following pre-requisites should be fulfilled:
- A SharePoint Usage and Health Service application should be created and should be configured to collect usage and health data. To know how to create and configure this application, follow the steps detailed in Configuring the eG Agent to Collect Usage Analytics.
- The SharePoint Developer Dashboard should be enabled. The steps for the same are detailed in Enabling the SharePoint Developer Dashboard.
Note:
This test is not applicable when the target server is a Microsoft SharePoint 2010 server
Target of the test : A Microsoft SharePoint Server
Agent deploying the test : An internal/remote agent
Outputs of the test : One set of results for each web site containing web parts that process requests for a duration longer than the configured Max Acceptable Duration
| Parameters | Description |
|---|---|
|
Test period |
This indicates how often should the test be executed. |
|
Host |
The host for which the test is to be configured. |
|
Port |
The port at which the host server listens. |
|
SQL Port Number |
Specify the port number of the SQL server that hosts the SharePoint Logging database. |
|
Instance |
If the SQL server that hosts the SharePoint Logging database is instance-based, then provide the instance name here. If not, then set this to none. |
|
SSL |
If the SQL server hosting the SharePoint Logging database is SSL-enabled, then set this flag to Yes. If not, set it to No. |
|
Isntlmv2 |
In some Windows networks, NTLM (NT LAN Manager) may be enabled. NTLM is a suite of Microsoft security protocols that provides authentication, integrity, and confidentiality to users. NTLM version 2 (“NTLMv2”) was concocted to address the security issues present in NTLM. By default, the Isntlmv2 flag is set to No, indicating that NTLMv2 is not enabled by default on the SQL server that hosts the SharePoint Logging database. Set this flag to Yes if NTLMv2 is enabled on that SQL server. |
|
Database Domain |
Specify the fully qualified name of the domain in which the Microsoft SQL server hosting the SharePoint Logging database operates. For instance, your specification can be: SharePoint.eginnovations.com |
|
Database server Name |
Specify the name of Microsoft SQL server that hosts the SharePoint Logging database to be accessed by this test. |
|
Database Name |
Specify the name of the SharePoint Logging database that this test should access. |
|
Database User Name, Database Password, Confirm Password |
Specify the credentials of a user who has db_datareader access to the SharePoint Logging database configured, in the Database User Name and Database Password text boxes. Then, confirm the password by retyping it in the Confirm Password text box. |
|
Max Acceptable Duration |
By default, this parameter is set to 3 (seconds). This implies that this test, by default, will report metrics for only those web sites containing one/more web parts that process requests for a duration longer than the 3 seconds. You can increase or decrease the value of this parameter, depending upon what you think is ‘slow’ in your environment. This way, you can configure the test to focus on only those web sites that contain slow or critical web parts alone. |
|
URL patterns to be ignored from monitoring |
By default, this test does not track requests to the following URL patterns: *.js,*.css,*.jpeg,*.jpg,*.png,*.asmx,*.ashx,*.svc,*.dlll. If required, you can remove one/more patterns from this default list, so that such patterns are monitored, or can append more patterns to this list in order to exclude them from monitoring. For instance, to additionally ignore URLs that end with .gif and .bmp when monitoring, you need to alter the default specification as follows: *.js,*.css,*.jpeg,*.jpg,*.png,*.asmx,*.ashx,*.svc,*.dlll,*.gif,*.bmp |
|
Ignore AjaxDelta Pages |
By default, this test ignores all requests to AjaxDelta pages. This is why, the Ignore AjaxDelta Pages is set to Yes by default. If you want the test to track requests to the AjaxDelta pages as well, set this flag to No. |
|
Fetch Farm Measures |
Typicaly, farm-level metrics - eg., metrics on farm status, site collections, usage analytics - will not vary from one SharePoint server in the farm to another. If these metrics are collected and stored in the eG database for each monitored server in the SharePoint farm, it is bound to unnecessarily consume space in the database and increase processing overheads. To avoid this, farm-level metrics collection is by default switched off for the member servers in the SharePoint farm, and enabled only if the server being monitored is provisioned as the Central Administration site. Accordingly, this parameter is set to If Central Administration by default. This default setting ensures that farm-level metrics are collected from and stored in the database for only a single SharePoint server in the farm. If you want to completely switch-off farm-level metrics collection for a SharePoint farm, then set this parameter to No. Some high-security environments may not allow an eG agent to be deployed on the Central Administration site. Administrators of such environments may however require farm-level insights into status and performance. To provide these insights for such environments, you can optionally enable farm-level metrics collection from any monitored member server in the farm, even if that server is not provisioned as the Central Administration site. For this, set this parameter to Yes when configuring this test for that member server. |
|
Domain, Domain User, Password, and Confirm Password |
If the Fetch Farm Measures flag of these tests is set to No or to If Central Administration Site, then this test should be configured with the credentials of a user with the following privileges:
On the other hand, if the Fetch Farm Measures flag of these tests is set to Yes, then the user configured for the tests not only requires the four privileges discussed above, but should also be part of the following groups on the eG agent host:
It is recommended that you create a special user for this purpose and assign the aforesaid privileges to him/her. Once such a user is created, specify the domain to which that user belongs in the Domain text box, and then, enter the credentials of the user in the Domain User and Password text boxes. To confirm the password, retype it in the Confirm Password text box. |
|
DD Frequency |
Refers to the frequency with which detailed diagnosis measures are to be generated for this test. The default is 1:1. This indicates that, by default, detailed measures will be generated every time this test runs, and also every time the test detects a problem. You can modify this frequency, if you so desire. Also, if you intend to disable the detailed diagnosis capability for this test, you can do so by specifying none against DD frequency. |
|
Detailed Diagnosis |
To make diagnosis more efficient and accurate, the eG Enterprise embeds an optional detailed diagnostic capability. With this capability, the eG agents can be configured to run detailed, more elaborate tests as and when specific problems are detected. To enable the detailed diagnosis capability of this test for a particular server, choose the On option. To disable the capability, click on the Off option. The option to selectively enable/disable the detailed diagnosis capability will be available only if the following conditions are fulfilled:
|
| Measurement | Description | Measurement Unit | Interpretation |
|---|---|---|---|
|
Duration |
Indicates the time taken by the web parts in this web site to load. |
Secs |
Compare the value of this measure across web sites to identify the slowest web site. Use the detailed diagnosis of this measure to know the details of requests that were processed slowly by the web parts in this web site. |
|
CPU duration |
Indicates the time spent by the web parts in this web site processing requests. |
Secs |
If the value of the Duration measure is abnormally high, then compare the value of this measure with that of the Total SQL duration and Total service call duration measures to determine the accurate source of the slowness - is it because of processing delays in the web parts? Is it because the web parts took too long to generate service calls? Or is it owing to inefficient queries run by the web parts in the backend database? |
|
SQL queries |
Indicates the number of queries executed by the web parts in this web site. |
Number |
Use the detailed diagnosis of this measure to know which queries were run and the duration of each query. This way, long running queries can be identified. |
|
Total SQL duration |
Indicates the total time taken by the web parts in this web site to run SQL queries. |
Secs |
If the value of the Duration measure is abnormally high, then compare the value of this measure with that of the Total CPU duration and Total service call duration measures to determine the accurate source of the slowness - – is it because of processing delays in the web parts? Is it because the web parts took too long to generate service calls? Or is it owing to inefficient queries run by the web parts? If queries are delaying web part operations, use the detailed diagnosis of the SQL queries measure to identify the long running / inefficient queries and then proceed to fine-tune them. |
|
SharePoint requests |
Indicates the number of requests to the web parts in this web site. |
Number |
The detailed diagnosis of this measure reveals the URLs of the SharePoint requests and the processing time of each request. Requests for which the web parts in a web site took too long to respond can be isolated in this manner. |
|
Asserts |
Indicates the number of asserts performed by the web parts in this web site. |
Number |
|
|
Service calls |
Indicates the number of service calls generated by the web parts in this web site. |
Number |
The detailed diagnosis of this measure reveals the exact service calls that were generated by the web parts and the duration of each service call. Slow service calls can thus be identified. |
|
Total service call duration |
Indicates the total time taken by the web parts in this web site to generate service calls. |
Secs |
If the value of the Duration measure is abnormally high, then compare the value of this measure with that of the Total CPU duration and Total SQL duration measures to determine the accurate source of the slowness - is it because of processing delays in the web parts? Is it because the web parts took too long to generate service calls? Or is it owing to inefficient queries run by the web parts? If service calls are delaying web part operations, use the detailed diagnosis of the Service calls measure to identify those service calls that were taking too long to generate and execute. |
Use the detailed diagnosis of the Duration measure to know the details of requests that were processed slowly by the web parts in a web site. From these details, you can figure out the start time of each request, from which user the request was received, from which client the user connected to the web site, and on which server the web site was operating.
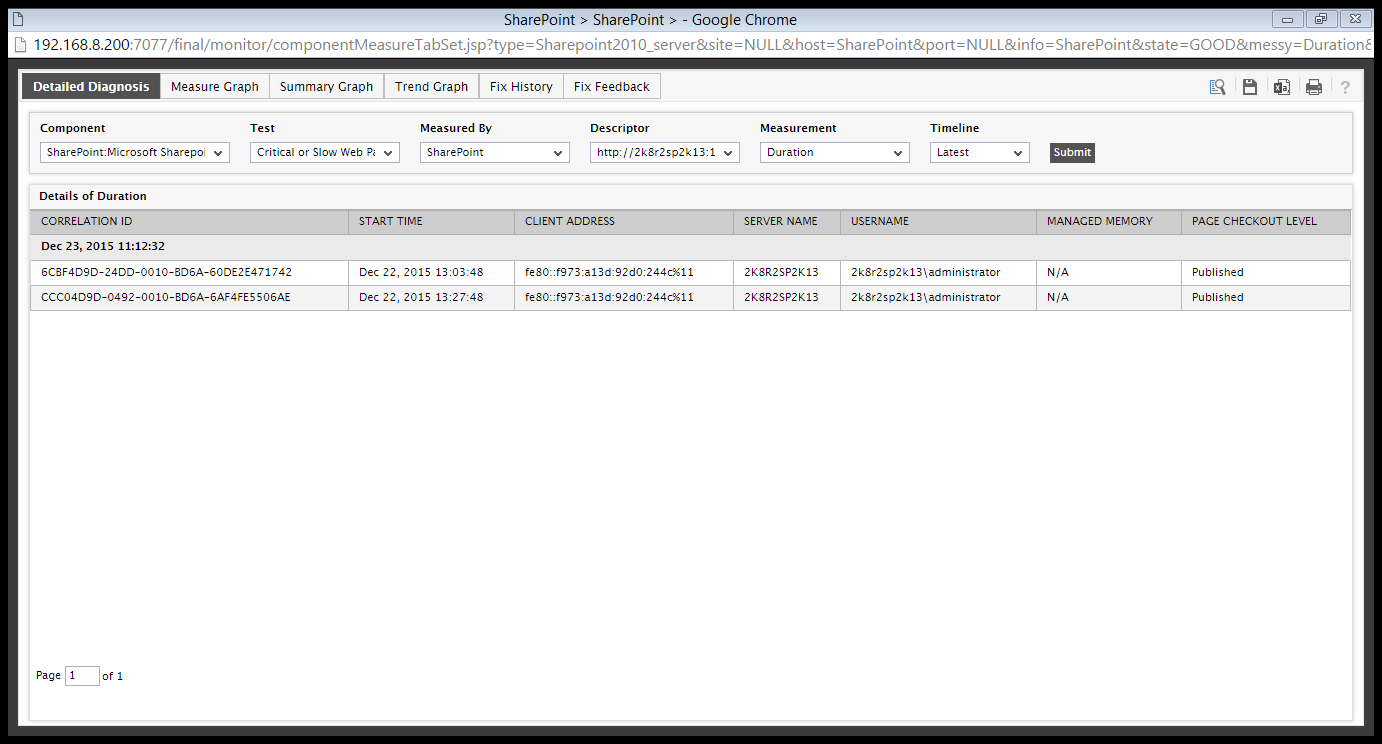
Figure 1 : The detailed diagnosis of the Duration measure
Use the detailed diagnosis of the SQL queries measure to know which queries were run and the duration of each query. This way, long running queries can be identified.
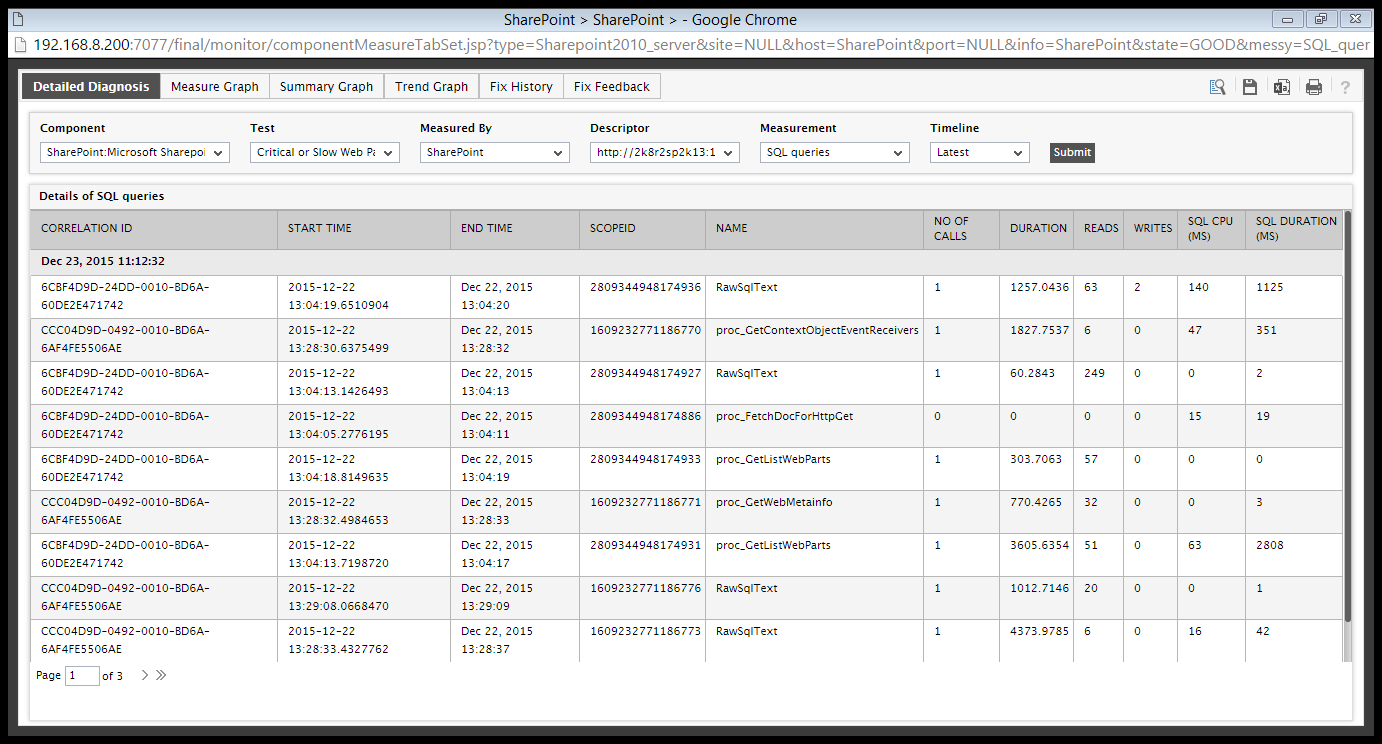
Figure 2 : The detailed diagnosis of the SQL queries measure
The detailed diagnosis of the SharePoint requests measure reveals the URLs of the SharePoint requests and the processing time of each request. Requests for which the web parts in a web site took too long to respond can be isolated in this manner.
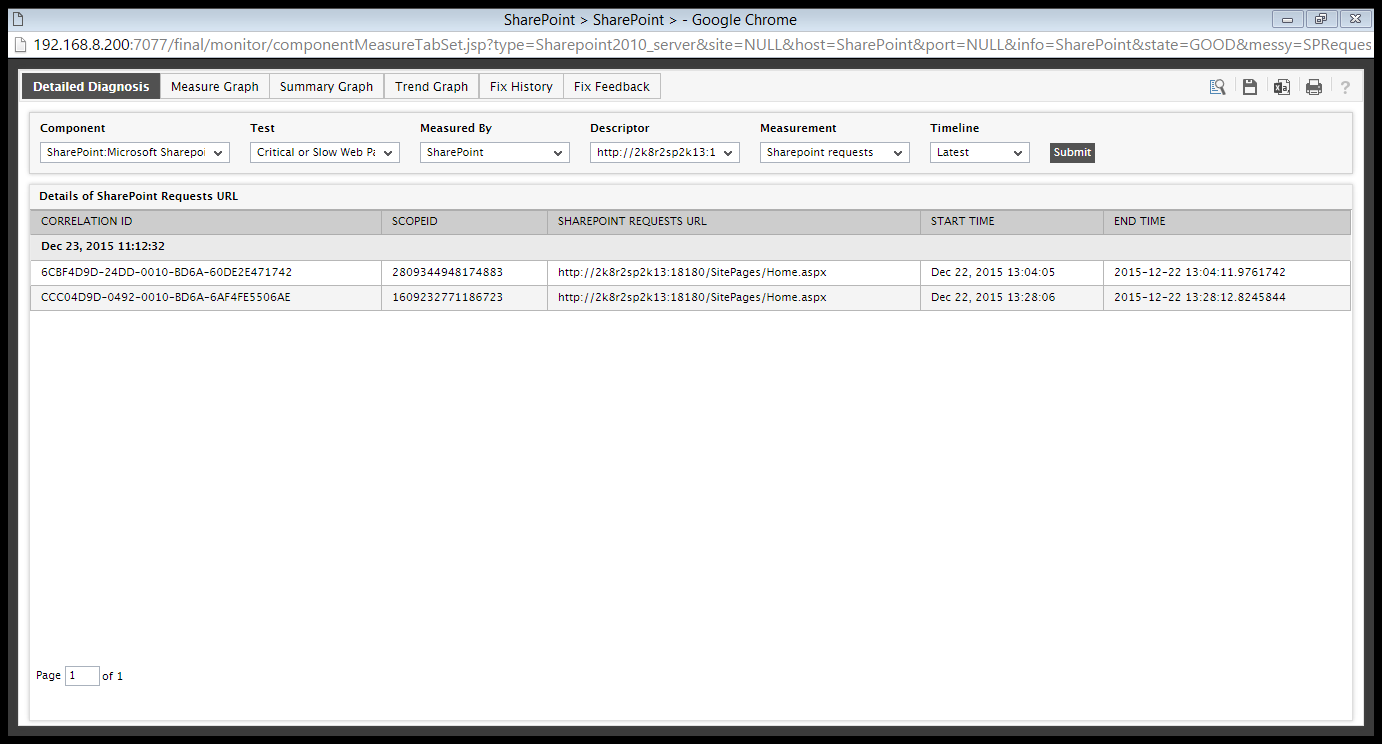
Figure 3 : The detailed diagnosis of the SharePoint requests measure
The detailed diagnosis of the Service calls measure reveals the exact service calls that were generated by the web parts and the duration of each service call. Slow service calls can thus be identified.
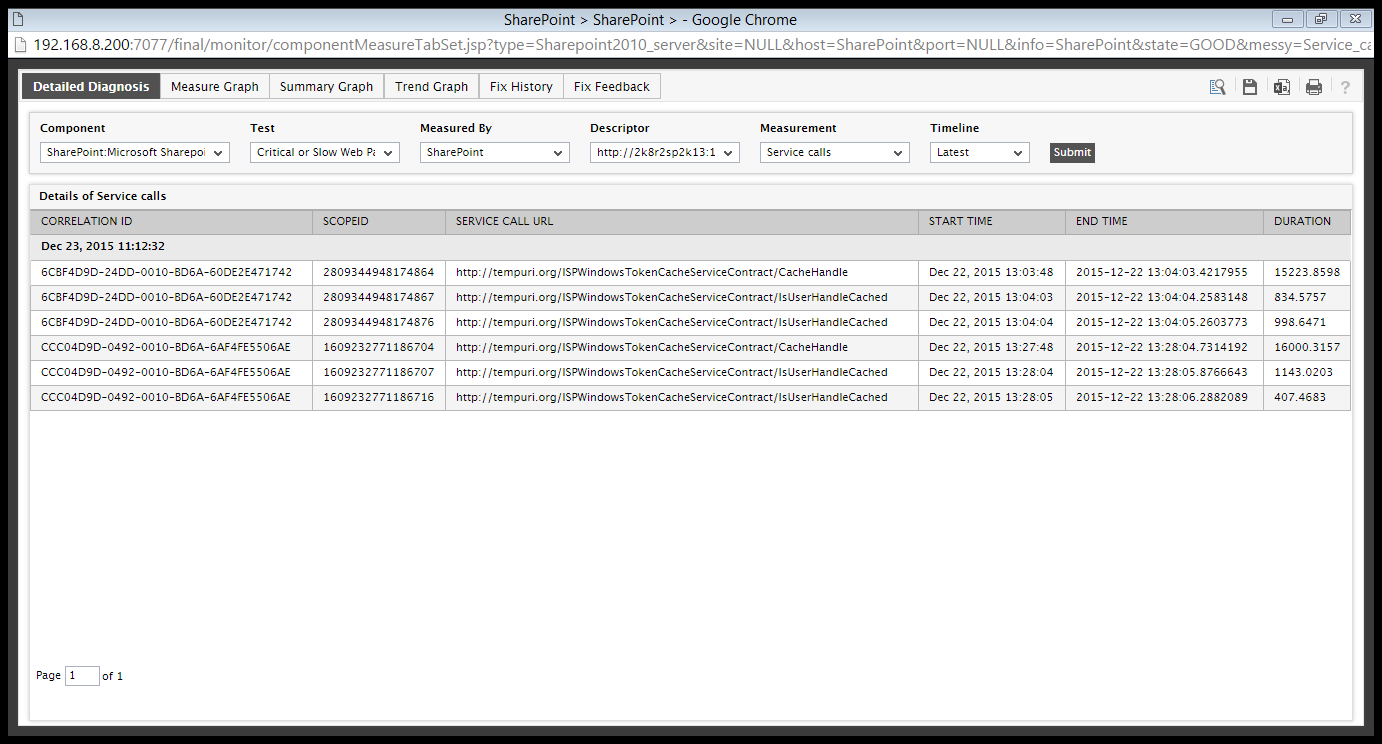
Figure 4 : The detailed diagnosis of the Service calls measure
Enabling the SharePoint Developer Dashboard
The Developer Dashboard is to help developers/ administrators with logging and debugging custom components that are added to SharePoint pages. It uses a simple process of elimination to isolate which component in a SharePoint page is the root cause for the slow performance. Developer Dashboard provides details on
- How long it took threads to process
- Details on the quantity and execution duration of SQL Server database calls and
- Details on Windows Communication Foundation (WCF) service calls
- Details on the URL
- Current user
- Load time etc.,
The Developer Dashboard can be turned on or enabled for an entire farm to get a snapshot of the activity and performance of a specific page request.
To enable this dashboard, run the following commands from the SharePoint management shell:
$content = ([Microsoft.SharePoint.Administration.SPWebService]::ContentService)
$appsetting =$content.DeveloperDashboardSettings
$appsetting.DisplayLevel = [Microsoft.SharePoint.Administration.SPDeveloperDashboardLevel]::On
$appsetting.Update()