SharePoint File Types Distribution Test
SharePoint users typically upload and/or download files of different types in a SharePoint environment. Administrators may choose to block some of these file types owing to various reasons. One of the most common reasons is to reduce space usage of files! Certain file types may not be critical to the business but may occupy significant space. If files of such types accumulate, they may not only deny space for business-critical information, but may even crash the sites they are uploaded to. To avoid this, the 'heavy' file types may be blocked.
But, how does an administrator know which file types are consuming space excessively? This is where the SharePoint File Types Distribution test helps! This test groups files uploaded to the SharePoint environment on the basis of their file types, and reports the number and total size of each file type. The percentage size distribution of every file type is also reported, so that administrators can instantly and accurately identify the file type that is hogging space! Using the detailed diagnosis of the test, you can easily pinpoint the exact file extensions that are occupying the maximum space.
By default, eG Enterprise groups a pre-defined set of file extensions under a file type. For instance, files with extensions .doc, .docx, .log, .msg, .odt, .pages, .rtf, .tex, .txt, .wpd, .and wps are by default grouped under the file type 'Text files'.Space usage statistics related to all the aforesaid extensions will hence be aggregated and reported for the measure group, "Text files". If required, you can add more extensions to a file type or remove existing extensions from a file type. For example, to make sure that files with the extensions, say .xls and .xlsx, are also classifed as "Text files", do the following:
- Edit the eg_tests.ini file in the <EG_INSTALL_DIR>\manager\config directory.
-
In the [Sharepoint2010_server] section of the file, you will find entries for each file type. In this section, look for the following entry:
Text_Files=.doc|Microsoft Word Document,.docx|Microsoft Word Open XML Document,.log|Log File,.msg|Outlook Mail Message,.odt|OpenDocument Text Document,.pages|Pages Document,.rtf|Rich Text Format File,.tex|LaTeX Source Document,.txt|Plain Text File,.wpd|WordPerfect Document,.wps|Microsoft, Works Word Processor Document
-
As you can see, the "Text_Files" parameter is set to a pipe-separated list of <DocumentType>,<FileExtension> pairs. For instance, in the pair Microsoft Word Document,.doc, .doc is the file extension that will be grouped under the measure group, "Text files". Microsoft Word Document will be displayed as the Document Type of all files with extension .doc, in the detailed diagnosis . Now, to make sure that files with extensions .xls and.xlsx are also grouped under the "Text files" measure group, append the following entry to the "Text_Files" parameter:
|Microsoft Excel,.xls|Microsoft Excel,.xlsx
The full Text_Files entry will now read as follows:
Text_Files=.doc|Microsoft Word Document,.docx|Microsoft Word Open XML Document,.log|Log File,.msg|Outlook Mail Message,.odt|OpenDocument Text Document,.pages|Pages Document,.rtf|Rich Text Format File,.tex|LaTeX Source Document,.txt|Plain Text File,.wpd|WordPerfect Document,.wps|Microsoft, Works Word Processor Document|Microsoft Excel,.xls|Microsoft Excel,.xlsx
- Finally, save the file.
Target of the test : A Microsoft SharePoint Server
Agent deploying the test : An internal/remote agent
Outputs of the test : One set of results for the SharePoint server being monitored.
| Parameters | Description |
|---|---|
|
Test period |
This indicates how often should the test be executed. |
|
Host |
The host for which the test is to be configured. |
|
Port |
The port at which the host server listens. |
|
Fetch Farm Measures |
Typically, farm-level metrics - eg., metrics on farm status, site collections, usage analytics - will not vary from one SharePoint server in the farm to another. If these metrics are collected and stored in the eG database for each monitored server in the SharePoint farm, it is bound to unnecessarily consume space in the database and increase processing overheads. To avoid this, farm-level metrics collection is by default switched off for the member servers in the SharePoint farm, and enabled only if the server being monitored is provisioned as the Central Administration site. Accordingly, this parameter is set to If Central Administration by default. This default setting ensures that farm-level metrics are collected from and stored in the database for only a single SharePoint server in the farm. If you want to completely switch-off farm-level metrics collection for a SharePoint farm, then set this parameter to No. Some high-security environments may not allow an eG agent to be deployed on the Central Administration site. Administrators of such environments may however require farm-level insights into status and performance. To provide these insights for such environments, you can optionally enable farm-level metrics collection from any monitored member server in the farm, even if that server is not provisioned as the Central Administration site. For this, set this parameter to Yes when configuring this test for that member server. |
|
Domain, Domain User, Password, and Confirm Password |
If the Fetch Farm Measures flag of these tests is set to No or to If Central Administration Site, then this test should be configured with the credentials of a user with the following privileges:
On the other hand, if the Fetch Farm Measures flag of these tests is set to Yes, then the user configured for the tests not only requires the four privileges discussed above, but should also be part of the following groups on the eG agent host:
It is recommended that you create a special user for this purpose and assign the aforesaid privileges to him/her. Once such a user is created, specify the domain to which that user belongs in the Domain text box, and then, enter the credentials of the user in the Domain User and Password text boxes. To confirm the password, retype it in the Confirm Password text box. |
|
DD Frequency |
Refers to the frequency with which detailed diagnosis measures are to be generated for this test. The default is 1:1. This indicates that, by default, detailed measures will be generated every time this test runs, and also every time the test detects a problem. You can modify this frequency, if you so desire. Also, if you intend to disable the detailed diagnosis capability for this test, you can do so by specifying none against DD frequency. |
|
Detailed Diagnosis |
To make diagnosis more efficient and accurate, the eG Enterprise embeds an optional detailed diagnostic capability. With this capability, the eG agents can be configured to run detailed, more elaborate tests as and when specific problems are detected. To enable the detailed diagnosis capability of this test for a particular server, choose the On option. To disable the capability, click on the Off option. The option to selectively enable/disable the detailed diagnosis capability will be available only if the following conditions are fulfilled:
|
| Measurement | Description | Measurement Unit | Interpretation |
|---|---|---|---|
|
Text files |
Indicates the number of text files presently in SharePoint. |
Number |
|
|
Text files size |
Indicates the total size of all the text files. |
MB |
|
|
Text files distribution |
Indicates the percentage of total space in the SharePoint environment that is occupied by the text files. |
Percent |
You can compare the value of this measure with that of the other "distribution" measures to know which file type is hogging the space. A value close to 100% is a cause for concern, as it indicates that text files are occupying almost all the space in the environment. In such a case, use the detailed diagnosis of the measure to know which file extensions specifically are eroding the space. |
|
Data files |
Indicates the number of files of type data in the SharePoint environment. |
Number |
|
|
Data files size |
Indicates the total size of all data files. |
MB |
|
|
Data files distribution |
Indicates the percentage of total space in the environment that is occupied by the data files. |
Percent |
You can compare the value of this measure with that of the other "distribution" measures to know which file type is hogging the space. A value close to 100% is a cause for concern, as it indicates that data files are occupying almost all the space in the environment. In such a case, use the detailed diagnosis of the measure to know which file extensions specifically are eroding the space. |
|
Audio files |
Indicates the number of files of type audio in the SharePoint environment. |
Number |
|
|
Audio files size |
Indicates the total size of all audio files. |
MB |
|
|
Audio files distribution |
Indicates the percentage of total space in the environment that is occupied by the audio files. |
Percent |
You can compare the value of this measure with that of the other "distribution" measures to know which file type is hogging the space. A value close to 100% is a cause for concern, as it indicates that audio files are occupying almost all the space in the environment. In such a case, use the detailed diagnosis of the measure to know which file extensions specifically are eroding the space. |
|
Video files |
Indicates the number of files of type video in the SharePoint environment. |
Number |
|
|
Video files size |
Indicates the total size of all video files. |
MB |
|
|
Video files distribution |
Indicates the percentage of total space in the environment that is occupied by the video files. |
Percent |
You can compare the value of this measure with that of the other "distribution" measures to know which file type is hogging the space. A value close to 100% is a cause for concern, as it indicates that video files are occupying almost all the space in the environment. In such a case, use the detailed diagnosis of the measure to know which file extensions specifically are eroding the space. |
|
3D image files |
Indicates the number of files of type 3D images in the SharePoint environment. |
Number |
|
|
3D images files size |
Indicates the total size of all 3D image files. |
MB |
|
|
3D image files distribution |
Indicates the percentage of total space in the environment that is occupied by the 3D image files. |
Percent |
You can compare the value of this measure with that of the other "distribution" measures to know which file type is hogging the space. A value close to 100% is a cause for concern, as it indicates that 3D image files are occupying almost all the space in the environment. In such a case, use the detailed diagnosis of the measure to know which file extensions specifically are eroding the space. |
|
Raster image files |
Indicates the number of files of type raster image in the SharePoint environment. |
Number |
|
|
Raster image files size |
Indicates the total size of all raster image files. |
MB |
|
|
Raster image files distribution |
Indicates the percentage of total space in the environment that is occupied by the raster image files. |
Percent |
You can compare the value of this measure with that of the other "distribution" measures to know which file type is hogging the space. A value close to 100% is a cause for concern, as it indicates that raster image files are occupying almost all the space in the environment. In such a case, use the detailed diagnosis of the measure to know which file extensions specifically are eroding the space. |
|
Vector image files |
Indicates the number of files of type vector image in the SharePoint environment. |
Number |
|
|
Vector image files size |
Indicates the total size of all vector image files. |
MB |
|
|
Vector image files distribution |
Indicates the percentage of total space in the environment that is occupied by the vector image files. |
Percent |
You can compare the value of this measure with that of the other "distribution" measures to know which file type is hogging the space. A value close to 100% is a cause for concern, as it indicates that vector image files are occupying almost all the space in the environment. In such a case, use the detailed diagnosis of the measure to know which file extensions specifically are eroding the space. |
|
Page layout files |
Indicates the number of files of type page layout in the SharePoint environment. |
Number |
|
|
Page layout files size |
Indicates the total size of all page layout files. |
MB |
|
|
Page layout files distribution |
Indicates the percentage of total space in the environment that is occupied by the page layout files. |
Percent |
You can compare the value of this measure with that of the other "distribution" measures to know which file type is hogging the space. A value close to 100% is a cause for concern, as it indicates that page layout files are occupying almost all the space in the environment. In such a case, use the detailed diagnosis of the measure to know which file extensions specifically are eroding the space. |
|
Spreadsheet files |
Indicates the number of files of type spreadsheet in the SharePoint environment. |
Number |
|
|
Spreadsheet files size |
Indicates the total size of all spreadsheet files. |
MB |
|
|
Spreadsheet files distribution |
Indicates the percentage of total space in the environment that is occupied by the spreadsheet files. |
Percent |
You can compare the value of this measure with that of the other "distribution" measures to know which file type is hogging the space. A value close to 100% is a cause for concern, as it indicates that spreadsheet files are occupying almost all the space in the environment. In such a case, use the detailed diagnosis of the measure to know which file extensions specifically are eroding the space. |
|
Database files |
Indicates the number of files of type database in the SharePoint environment. |
Number |
|
|
Database files size |
Indicates the total size of all database files. |
MB |
|
|
Database files distribution |
Indicates the percentage of total space in the environment that is occupied by the database files. |
Percent |
You can compare the value of this measure with that of the other "distribution" measures to know which file type is hogging the space. A value close to 100% is a cause for concern, as it indicates that database files are occupying almost all the space in the environment. In such a case, use the detailed diagnosis of the measure to know which file extensions specifically are eroding the space. |
|
Executable files |
Indicates the number of files of type executable in the SharePoint environment. |
Number |
|
|
Executable files size |
Indicates the total size of all executable files. |
MB |
|
|
Executables files distribution |
Indicates the percentage of total space in the environment that is occupied by the executable files. |
Percent |
You can compare the value of this measure with that of the other "distribution" measures to know which file type is hogging the space. A value close to 100% is a cause for concern, as it indicates that executable files are occupying almost all the space in the environment. In such a case, use the detailed diagnosis of the measure to know which file extensions specifically are eroding the space. |
|
Game files |
Indicates the number of files of type game in the SharePoint environment. |
Number |
|
|
Game files size |
Indicates the total size of all game files. |
MB |
|
|
Games files distribution |
Indicates the percentage of total space in the environment that is occupied by the game files. |
Percent |
You can compare the value of this measure with that of the other "distribution" measures to know which file type is hogging the space. A value close to 100% is a cause for concern, as it indicates that game files are occupying almost all the space in the environment. In such a case, use the detailed diagnosis of the measure to know which file extensions specifically are eroding the space. |
|
CAD files |
Indicates the number of files of type CAD in the SharePoint environment. |
Number |
|
|
CAD files size |
Indicates the total size of all CAD files. |
MB |
|
|
CAD files distribution |
Indicates the percentage of total space in the environment that is occupied by the CAD files. |
Percent |
You can compare the value of this measure with that of the other "distribution" measures to know which file type is hogging the space. A value close to 100% is a cause for concern, as it indicates that CAD files are occupying almost all the space in the environment. In such a case, use the detailed diagnosis of the measure to know which file extensions specifically are eroding the space. |
|
GIS files |
Indicates the number of files of type GIS in the SharePoint environment. |
Number |
|
|
GIS files size |
Indicates the total size of all GIS files. |
MB |
|
|
GIS files size distribution |
Indicates the percentage of total space in the environment that is occupied by the GIS files. |
Percent |
You can compare the value of this measure with that of the other "distribution" measures to know which file type is hogging the space. A value close to 100% is a cause for concern, as it indicates that GIS files are occupying almost all the space in the environment. In such a case, use the detailed diagnosis of the measure to know which file extensions specifically are eroding the space. |
|
Web files |
Indicates the number of files of type web in the SharePoint environment. |
Number |
|
|
Web files size |
Indicates the total size of all web files. |
MB |
|
|
Web files distribution |
Indicates the percentage of total space in the environment that is occupied by the web files. |
Percent |
You can compare the value of this measure with that of the other "distribution" measures to know which file type is hogging the space. A value close to 100% is a cause for concern, as it indicates that web files are occupying almost all the space in the environment. In such a case, use the detailed diagnosis of the measure to know which file extensions specifically are eroding the space. |
|
Plugin files |
Indicates the number of files of type plugin in the SharePoint environment. |
Number |
|
|
Plugin files size |
Indicates the total size of all plugin files. |
MB |
|
|
Plugin files distribution |
Indicates the percentage of total space in the environment that is occupied by the plugin files. |
Percent |
You can compare the value of this measure with that of the other "distribution" measures to know which file type is hogging the space. A value close to 100% is a cause for concern, as it indicates that plugin files are occupying almost all the space in the environment. In such a case, use the detailed diagnosis of the measure to know which file extensions specifically are eroding the space. |
|
Font files |
Indicates the number of files of type font in the SharePoint environment. |
Number |
|
|
Font files size |
Indicates the total size of all font files. |
MB |
|
|
Font files distribution |
Indicates the percentage of total space in the environment that is occupied by the font files. |
Percent |
You can compare the value of this measure with that of the other "distribution" measures to know which file type is hogging the space. A value close to 100% is a cause for concern, as it indicates that font files are occupying almost all the space in the environment. In such a case, use the detailed diagnosis of the measure to know which file extensions specifically are eroding the space. |
|
System files |
Indicates the number of files of type system in the SharePoint environment. |
Number |
|
|
System files size |
Indicates the total size of all system files. |
MB |
|
|
System files distribution |
Indicates the percentage of total space in the environment that is occupied by the system files. |
Percent |
You can compare the value of this measure with that of the other "distribution" measures to know which file type is hogging the space. A value close to 100% is a cause for concern, as it indicates that system files are occupying almost all the space in the environment. In such a case, use the detailed diagnosis of the measure to know which file extensions specifically are eroding the space. |
|
Settings files |
Indicates the number of files of type settings in the SharePoint environment. |
Number |
|
|
Settings files size |
Indicates the total size of all settings files. |
MB |
|
|
Settings files distribution |
Indicates the percentage of total space in the environment that is occupied by the settings files. |
Percent |
You can compare the value of this measure with that of the other "distribution" measures to know which file type is hogging the space. A value close to 100% is a cause for concern, as it indicates that settings files are occupying almost all the space in the environment. In such a case, use the detailed diagnosis of the measure to know which file extensions specifically are eroding the space. |
|
Encoded files |
Indicates the number of files of type encoded in the SharePoint environment. |
Number |
|
|
Encoded files size |
Indicates the total size of all encoded files. |
MB |
|
|
Encoded files distribution |
Indicates the percentage of total space in the environment that is occupied by the encoded files. |
Percent |
You can compare the value of this measure with that of the other "distribution" measures to know which file type is hogging the space. A value close to 100% is a cause for concern, as it indicates that encoded files are occupying almost all the space in the environment. In such a case, use the detailed diagnosis of the measure to know which file extensions specifically are eroding the space. |
|
Compressed files |
Indicates the number of files of type compressed in the SharePoint environment. |
Number |
|
|
Compressed files size |
Indicates the total size of all compressed files. |
MB |
|
|
Compressed files distribution |
Indicates the percentage of total space in the environment that is occupied by the compressed files. |
Percent |
You can compare the value of this measure with that of the other "distribution" measures to know which file type is hogging the space. A value close to 100% is a cause for concern, as it indicates that compressed files are occupying almost all the space in the environment. In such a case, use the detailed diagnosis of the measure to know which file extensions specifically are eroding the space. |
|
Disk image files |
Indicates the number of files of type disk image in the SharePoint environment. |
Number |
|
|
Disk images files size |
Indicates the total size of all disk image files. |
MB |
|
|
Disk image files distribution |
Indicates the percentage of total space in the environment that is occupied by the disk image files. |
Percent |
You can compare the value of this measure with that of the other "distribution" measures to know which file type is hogging the space. A value close to 100% is a cause for concern, as it indicates that disk image files are occupying almost all the space in the environment. In such a case, use the detailed diagnosis of the measure to know which file extensions specifically are eroding the space. |
|
Developer files |
Indicates the number of files of type developer in the SharePoint environment. |
Number |
|
|
Developer files size |
Indicates the total size of all developer files. |
MB |
|
|
Developer files distribution |
Indicates the percentage of total space in the environment that is occupied by the developer files. |
Percent |
You can compare the value of this measure with that of the other "distribution" measures to know which file type is hogging the space. A value close to 100% is a cause for concern, as it indicates that developer files are occupying almost all the space in the environment. In such a case, use the detailed diagnosis of the measure to know which file extensions specifically are eroding the space. |
|
Backup files |
Indicates the number of files of type backup in the SharePoint environment. |
Number |
|
|
Backup files size |
Indicates the total size of all backup files. |
MB |
|
|
Backup files distribution |
Indicates the percentage of total space in the environment that is occupied by the backup files. |
Percent |
You can compare the value of this measure with that of the other "distribution" measures to know which file type is hogging the space. A value close to 100% is a cause for concern, as it indicates that backup files are occupying almost all the space in the environment. In such a case, use the detailed diagnosis of the measure to know which file extensions specifically are eroding the space. |
|
Miscellaneous files |
Indicates the number of files that are not of any of types listed above, in the SharePoint environment. |
Number |
|
|
Miscellaneous files size |
Indicates the total size of all the other files. |
MB |
|
|
Miscellaneous files distribution |
Indicates the percentage of total space in the environment that is occupied by all the other files. |
Percent |
You can compare the value of this measure with that of the other "distribution" measures to know which file type is hogging the space. A value close to 100% is a cause for concern, as it indicates that files of some random type are occupying almost all the space in the environment. In such a case, use the detailed diagnosis of the measure to know which file extensions specifically are eroding the space. |
Use the detailed diagnosis of the Text files measure to view the file extensions grouped under Text files and the space usage of each extension.
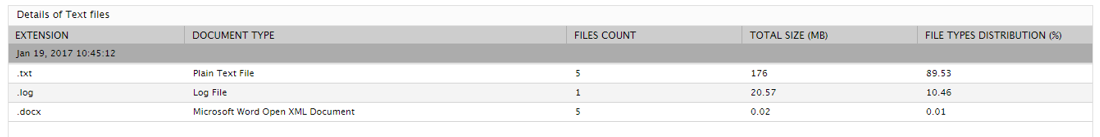
Figure 1 : The detailed diagnosis of the Text files measure