SharePoint Farm Test
A SharePoint farm is a collection of SharePoint servers or SQL servers that work in concert to provide a set of basic SharePoint services that support a single site.
Since the primary purpose of any farm is to provide high availability to servers and services, administrators should be proactively alerted if that farm goes down. If not, end-users will be denied access to all servers and services riding on that farm for long periods of time!
Administrators will also require deep visibility into what servers and services make up the farm and what their current status is. Without this, unavailable servers/services can neither be identified, nor restored!
Moreover, until serious performance issues surface, administrators tend to remain clueless about which servers in a farm are updated/upgraded with critical patches/hot fixes and which are not. To avoid this, administrators should continuously track the upgrade status of the farm and of the servers in the farm.
The SharePoint Farm test addresses all these requirements! The test auto-discovers the SharePoint farm in which the monitored SharePoint server resides. Periodically, the test checks the status of this farm and alerts you if the farm goes offline. This way, you can initiate timely measures for restoring the farm to normalcy and in the process, ensure that users are able to access servers and services continuously. The test also reports the number, types, and names of servers in this farm and points you to the offline servers. Disabled service instances in the farm are also brought to light by this test. Additionally, the test also draws your attention to servers in a farm that need to be upgraded, so that you can quickly apply the required patches/hot fixes on those servers and maximize their performance.
Target of the test : A Microsoft SharePoint Server
Agent deploying the test : An internal agent
Outputs of the test : One set of results for the SharePoint farm in which the monitored SharePoint server operates
| Parameters | Description |
|---|---|
|
Test period |
This indicates how often should the test be executed. |
|
Host |
The host for which the test is to be configured. |
|
Port |
The port at which the host server listens. |
|
Fetch Farm Measures |
Typically, farm-level metrics - eg., metrics on farm status, site collections, usage analytics - will not vary from one SharePoint server in the farm to another. If these metrics are collected and stored in the eG database for each monitored server in the SharePoint farm, it is bound to unnecessarily consume space in the database and increase processing overheads. To avoid this, farm-level metrics collection is by default switched off for the member servers in the SharePoint farm, and enabled only if the server being monitored is provisioned as the Central Administration site. Accordingly, this parameter is set to If Central Administration by default. This default setting ensures that farm-level metrics are collected from and stored in the database for only a single SharePoint server in the farm. If you want to completely switch-off farm-level metrics collection for a SharePoint farm, then set this parameter to No. Some high-security environments may not allow an eG agent to be deployed on the Central Administration site. Administrators of such environments may however require farm-level insights into status and performance. To provide these insights for such environments, you can optionally enable farm-level metrics collection from any monitored member server in the farm, even if that server is not provisioned as the Central Administration site. For this, set this parameter to Yes when configuring this test for that member server. |
|
Domain, Domain User, Password, and Confirm Password |
If the Fetch Farm Measures flag of these tests is set to No or to If Central Administration Site, then this test should be configured with the credentials of a user with the following privileges:
On the other hand, if the Fetch Farm Measures flag of these tests is set to Yes, then the user configured for the tests not only requires the four privileges discussed above, but should also be part of the following groups on the eG agent host:
It is recommended that you create a special user for this purpose and assign the aforesaid privileges to him/her. Once such a user is created, specify the domain to which that user belongs in the Domain text box, and then, enter the credentials of the user in the Domain User and Password text boxes. To confirm the password, retype it in the Confirm Password text box. |
|
Detailed Diagnosis |
To make diagnosis more efficient and accurate, the eG Enterprise embeds an optional detailed diagnostic capability. With this capability, the eG agents can be configured to run detailed, more elaborate tests as and when specific problems are detected. To enable the detailed diagnosis capability of this test for a particular server, choose the On option. To disable the capability, click on the Off option. The option to selectively enable/disable the detailed diagnosis capability will be available only if the following conditions are fulfilled:
|
| Measurement | Description | Measurement Unit | Interpretation | ||||||
|---|---|---|---|---|---|---|---|---|---|
|
Status |
Indicates the current status of this farm. |
|
The values that this measure can report and their corresponding numeric values are listed in the table below:
Note: This measure reports the Measure Values listed in the table above to indicate the status of a farm. In the graph of this measure however, farm status is represented using the numeric equivalents only. |
||||||
|
Needs upgrade? |
Indicates whether/not this farm needs an upgrade. |
|
The values that this measure can report and their corresponding numeric values are listed in the table below:
Note: This measure reports the Measure Values listed in the table above to indicate whether/not a farm needs an upgrade. In the graph of this measure however, the same is represented using the numeric equivalents only. If this measure reports the value No, it could be because the patches were applied on the servers in the farm, but the SharePoint Products Configuration Wizard was not run after patch application on a few servers. |
||||||
|
Total servers in farm |
Indicates the total number of servers in this farm. |
Number |
Use the detailed diagnosis of this measure to know which servers are in the farm, the status of each server, whether/not that server needs upgrade, and if so, whether/not it can be upgraded. |
||||||
|
Total service instances in farm |
Indicates the total number of service instances in this farm. |
Number |
Within a farm, there are several services that run on one or more servers. These services provide basic functionality for SharePoint and regulate which services should run on which servers, in an effort to manage the impact on overall farm architecture and performance. Use the detailed diagnosis of this measure to know the services running in the farm and the servers they are running on. This way, when one or more of these servers go down, you will be able to identify the services that will be impacted. |
||||||
|
Servers online |
Indicates the number of servers in this farm that are online currently. |
Number |
Use the detailed diagnosis of this measure to know which servers are online, whether/not that server needs upgrade, and if so, whether/not it can be upgraded. |
||||||
|
Servers offline |
Indicates the number of servers in this farm that are offline currently. |
Number |
Ideally, the value of this measure should be 0. Use the detailed diagnosis of this measure to know which servers are offline, , whether/not that server needs upgrade, and if so, whether/not it can be upgraded. |
||||||
|
Servers that need upgrade |
Indicates the number of servers in this farm that need to be upgraded. |
Number |
Use the detailed diagnosis of this measure to know which servers require an upgrade. |
||||||
|
Web front end servers |
Indicates the number of web front end servers in this farm. |
Number |
Use the detailed diagnosis of this measure to know which are the web front end servers in the farm. |
||||||
|
Application servers |
Indicates the number of application servers in this farm. |
Number |
Use the detailed diagnosis of this measure to know which are the application servers in the farm. |
||||||
|
Database servers |
Indicates the number of application servers in this farm.
|
Number |
Use the detailed diagnosis of this measure to know which database servers are in the farm. |
||||||
|
Online service instances |
Indicates the number of service instances running in this farm that are currently online. |
Number |
Use the detailed diagnosis of this measure to know which services are online and which servers they are running on. |
||||||
|
Offline service instances |
Indicates the number of service instances running in this farm that are currently offline. |
Number |
Ideally, the value of this measure should be 0. Use the detailed diagnosis of this measure to know which services are offline and which servers they are running on. |
||||||
|
Disabled service instances |
Indicates the number of service instances running in this farm that are currently disabled. |
Number |
Use the detailed diagnosis of this measure to know which services are disabled and which servers they are running on. |
Use the detailed diagnosis of the Total servers in farm measure to know which servers are in the farm, the status of each server, whether/not that server needs upgrade, and if so, whether/not it can be upgraded. Offline servers in the farm and the ones needing an upgrade can thus be identified.
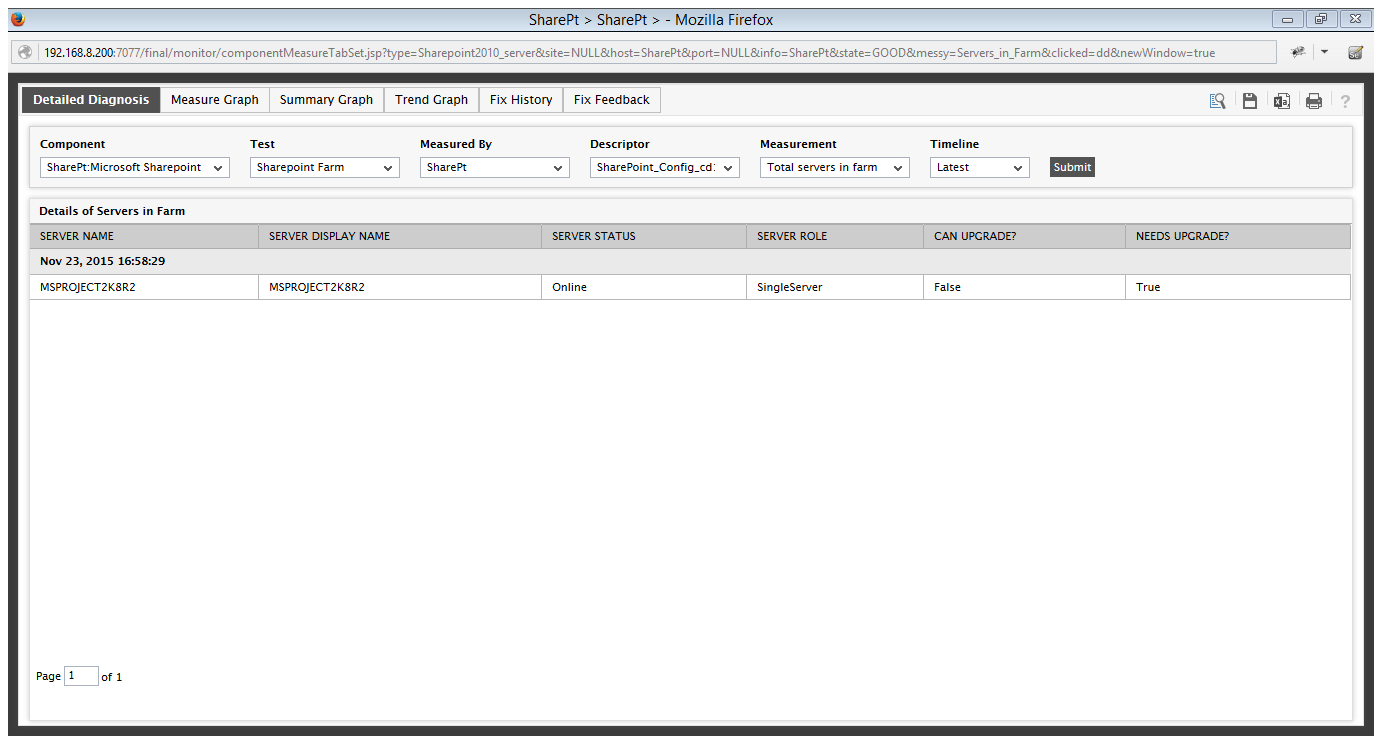
Figure 1 : The detailed diagnosis of the Total servers in farm measure
Use the detailed diagnosis of the Total service instances in farm measure to know the services running in the farm and the servers they are running on. This way, when one or more of these servers go down, you will be able to identify the services that will be impacted.

Figure 2 : The detailed diagnosis of the Total service instances in farm measure
Use the detailed diagnosis of the Servers online measure to know which servers are online, whether/not that server needs upgrade, and if so, whether/not it can be upgraded.
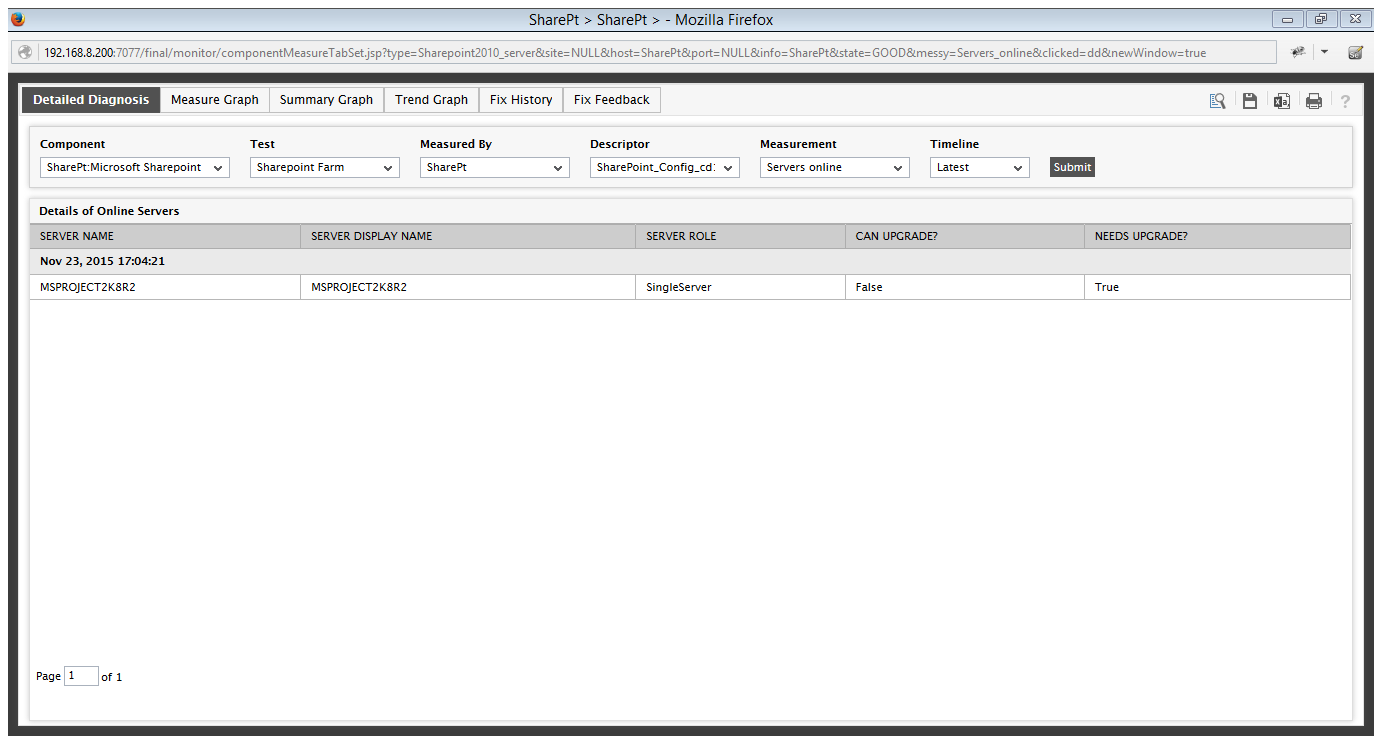
Figure 3 : The detailed diagnosis of the Servers online measure
Use the detailed diagnosis of the Servers that need upgrade measure to know which servers require an upgrade.
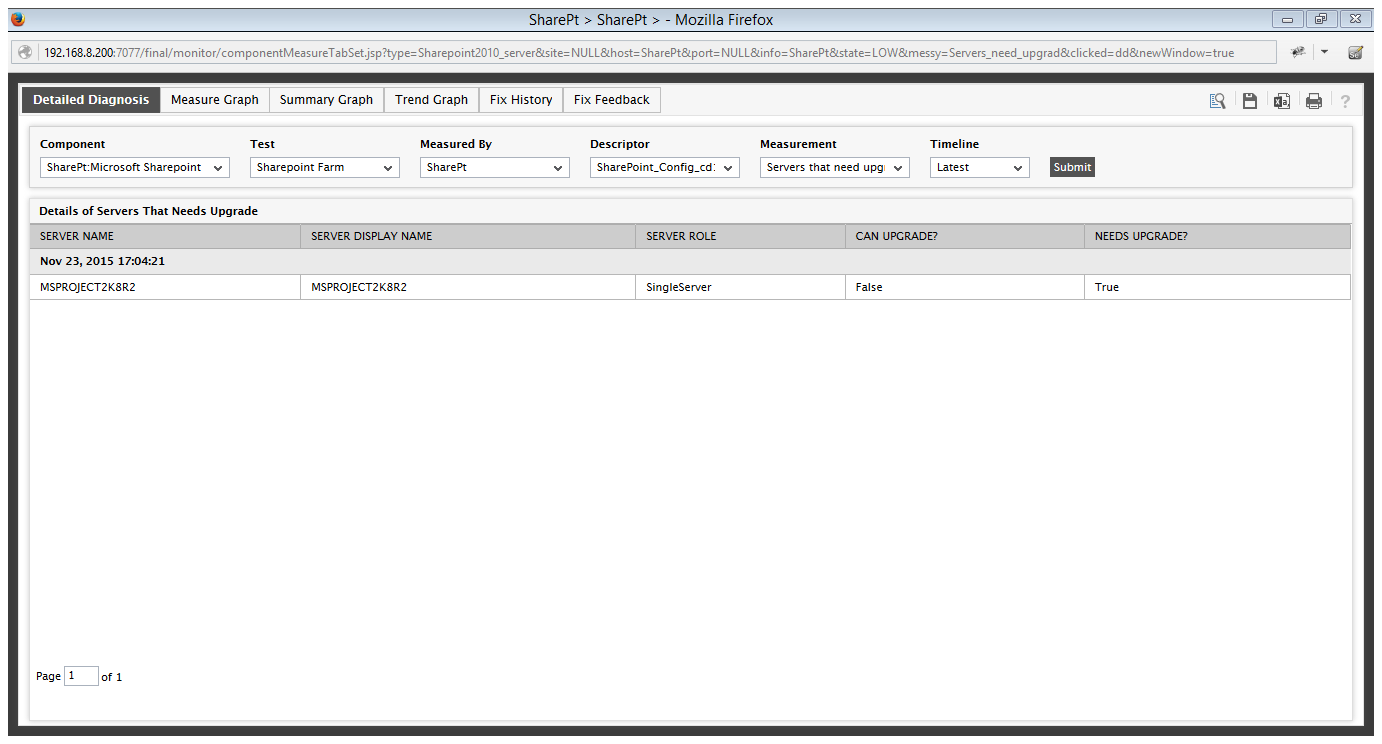
Figure 4 : The detailed diagnosis of the Servers that need upgrade measure
Use the detailed diagnosis of the Web front end servers measure to know which are the web front end servers in the farm.
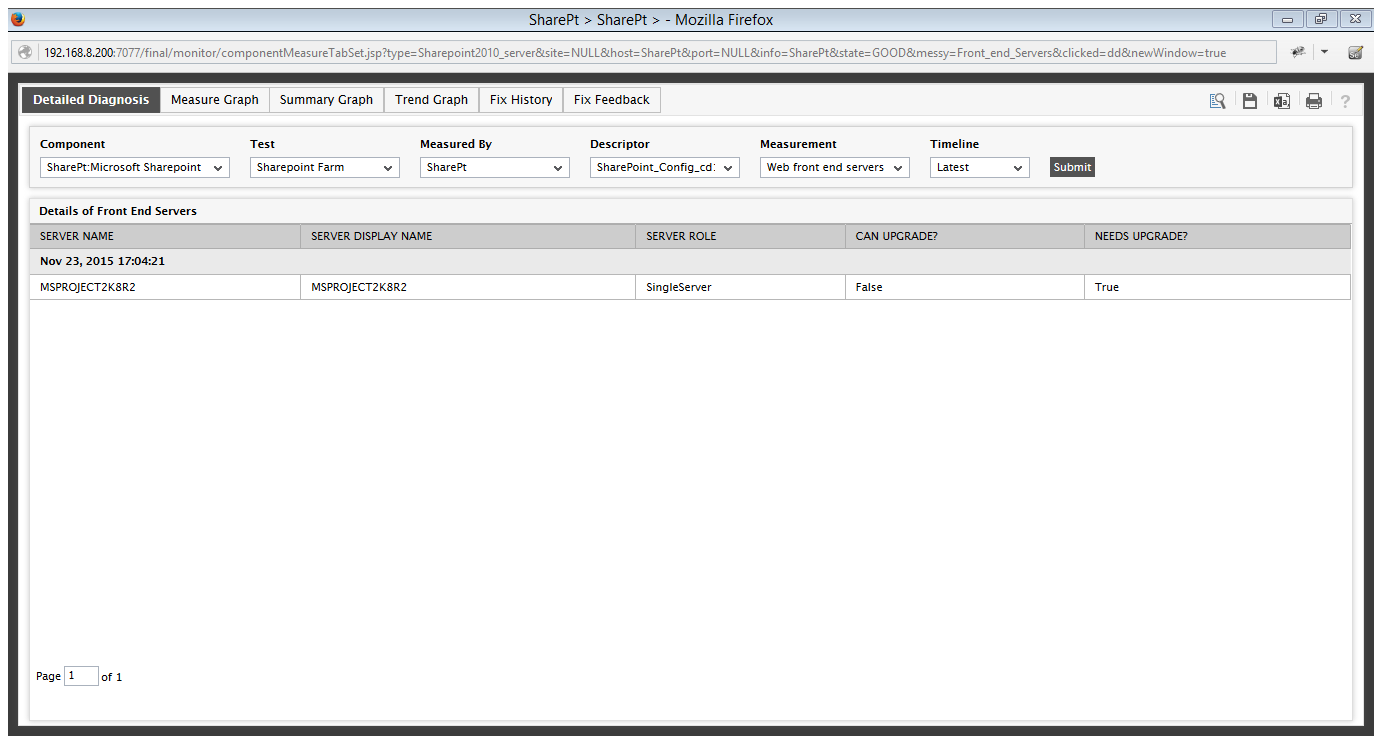
Figure 5 : The detailed diagnosis of the Web Front end servers
To know which are the application servers in the farm, use the detailed diagnosis of the Application servers measure.

Figure 6 : The detailed diagnosis of the Application servers measure
To identify the database servers in the farm, use the detailed diagnosis of the Database servers measure.
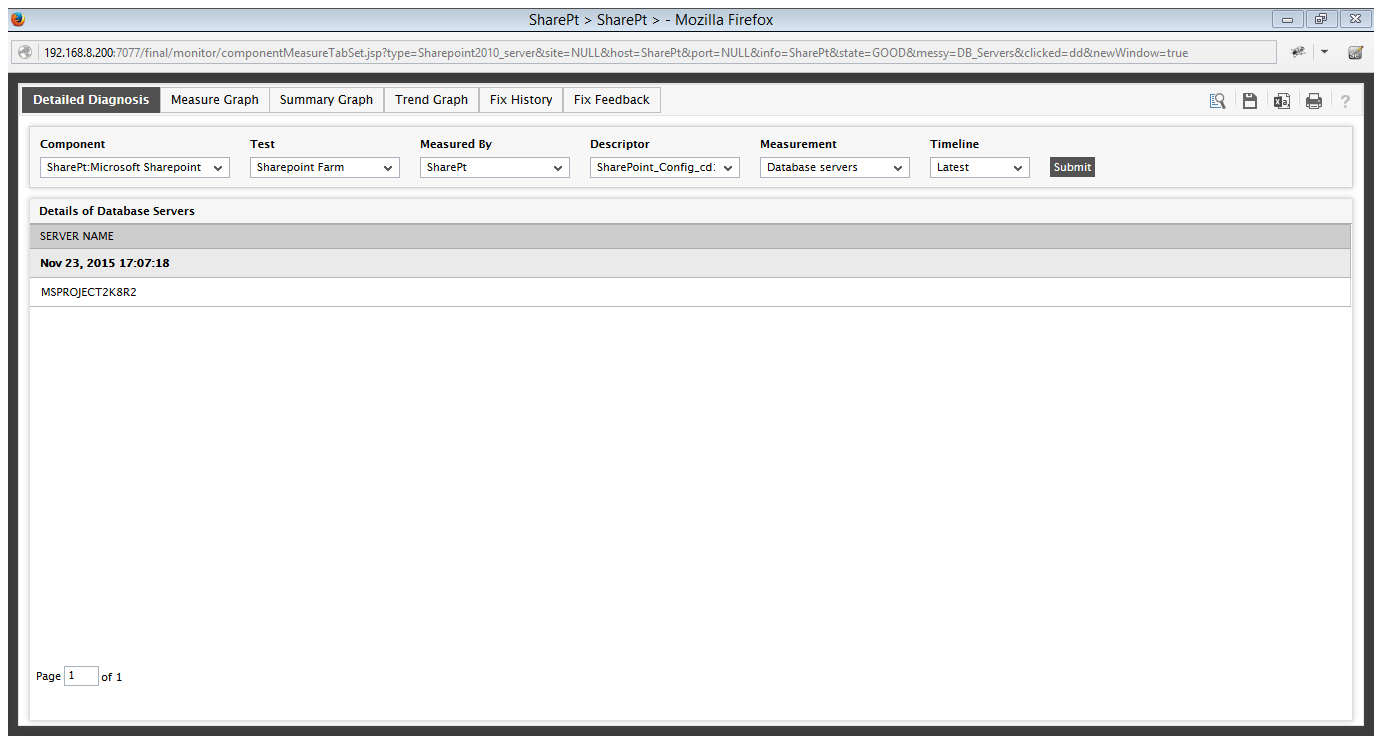
Figure 7 : The detailed diagnosis of the Database servers measure
Use the detailed diagnosis of the Online service instances measure to know which services are online and which servers they are running on.
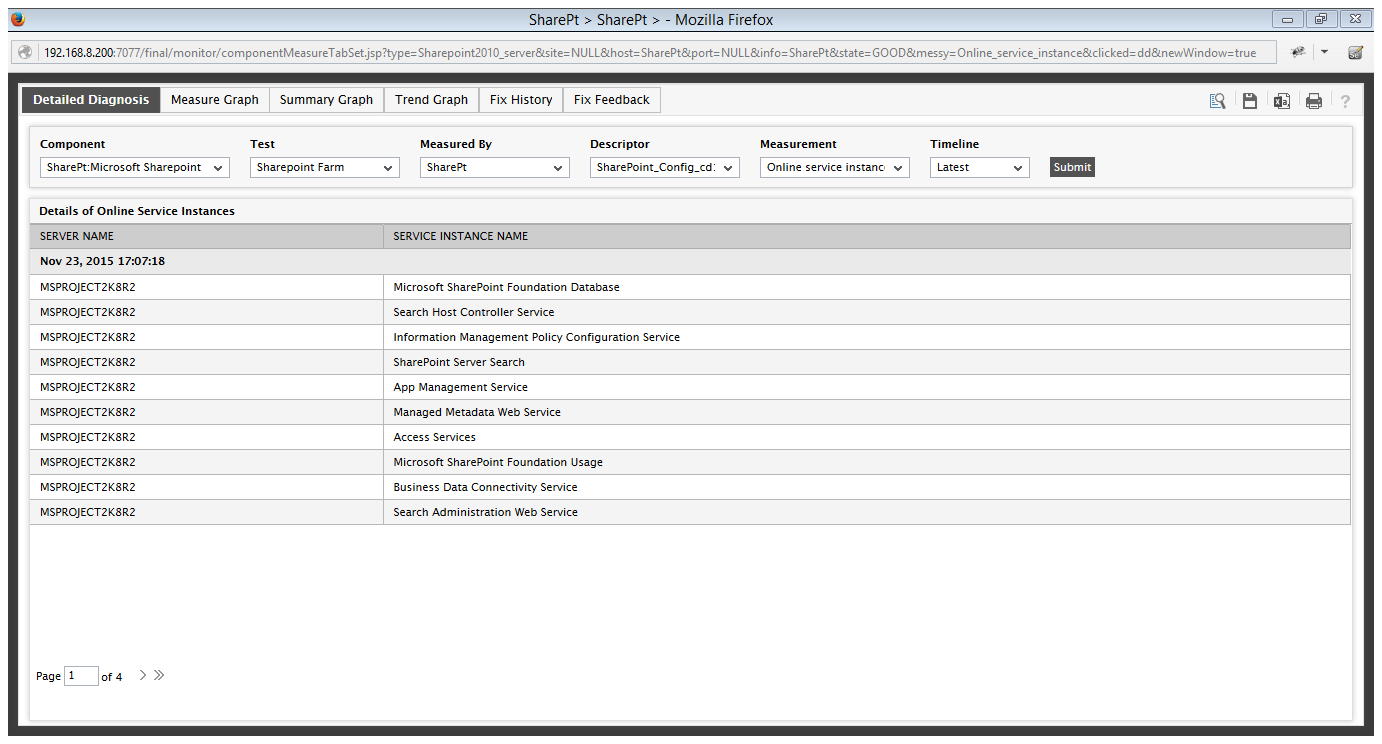
Figure 8 : The detailed diagnosis of the Online service instances measure
Use the detailed diagnosis of the Disabled service instances measure to know which services are disabled and which servers they are running on.
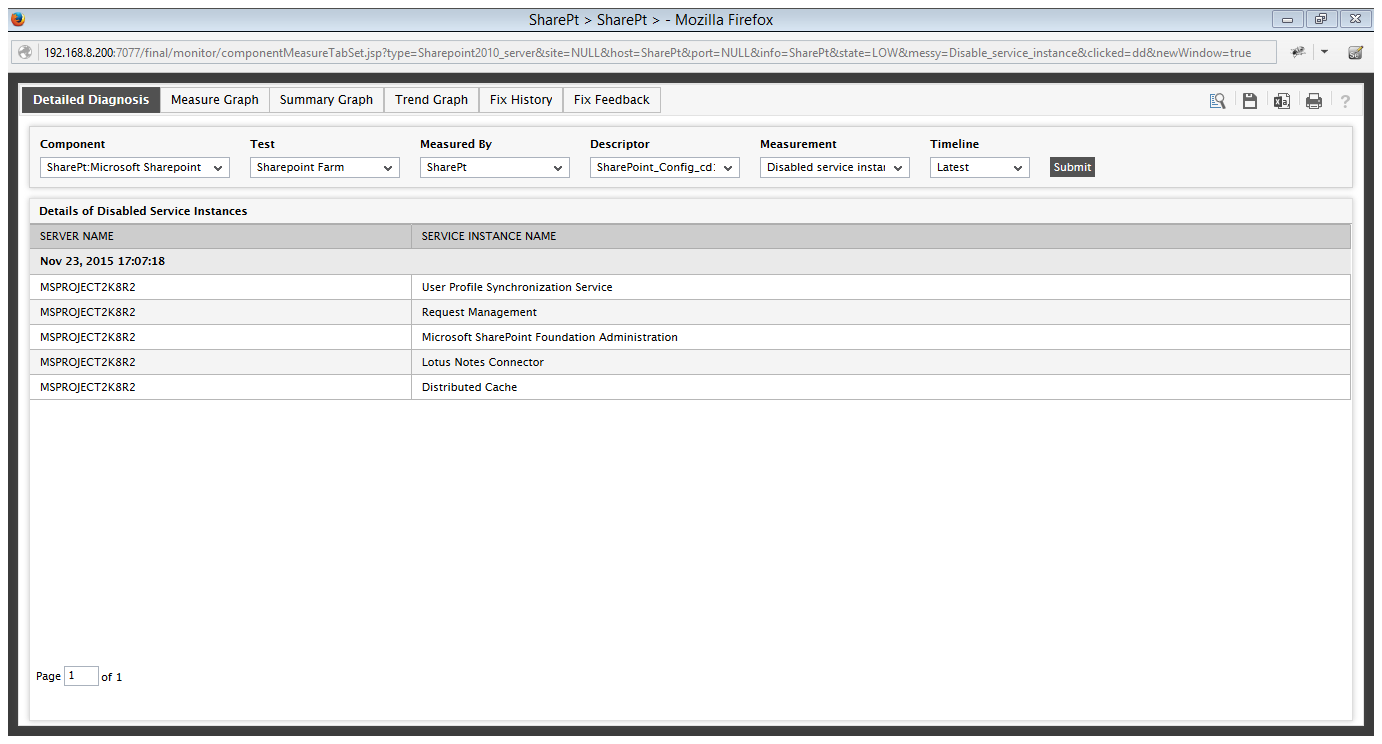
Figure 9 : The detailed diagnosis of the Disabled service instances measure