Monitoring Nutanix Prism Central
Monitoring Nutanix Prism Central is crucial for ensuring the efficient and reliable operation of your Nutanix-powered infrastructure. eG Enterprise provides a specialized monitoring model for the Nutanix Prism Central, refer Figure 1.
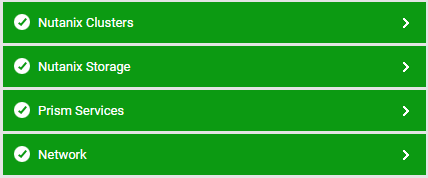
Figure 1 : Layer model of the Nutanix Prism Central
Each layer of Figure 1 is mapped to tests that invoke REST API commands to report a wide variety of metrics related to Prism Element health and the health of the cluster(s) managed by the Prism Central. Using these metrics, administrators can find quick and accurate answers to the following performance queries:
-
Is the Prism Central available? If so, how quickly is it responding to HTTP requests?
-
Which clusters are being managed by the Prism Central?
-
Is any cluster over-utilizing its compute and storage resources?
-
How is the I/O load on containers and/or storage pools? Is any container/storage pool overloaded with I/O requests?
-
Is any container/storage pool utilizing bandwidth excessively when serving I/O requests?
-
Is any container/storage pool latent?
-
Is any container/storage pool running out of storage space?
These layers are similar to that of the Nutanix Prism Element monitoring model; hence,