Groups Activity Test
An Office 365 Group is a way to centralize membership for multiple Microsoft products in one place, and apply policies at the project or team level instead of each product. Using Office 365 groups, you can create a shared space to communicate, collaborate, and schedule events with colleagues on a shared task, project, or resource.
Typically, members of a group communicate with each other over emails and using social networking platforms such as yammer. To disseminate information and collaborate on a project, they use SharePoint files. More often than not, administrators may want to track the level of communication / collaboration activity across groups, so they can determine whether/not adequate shared resources (eg., mailbox storage, site storage etc.) are available to the groups to handle the load. This is where the Groups Activity test helps!
This test monitors the yammer, email, and file activity across groups, and reports how much load these activities impose on mailbox storage and SharePoint site storage. This way, administrators can rapidly figure out if groups require additional storage space to handle the load. If the groups are utilizing mailbox and/or site storage abnormally, you can use the detailed diagnosis reported by the test to identify the top storage consumers - i.e., the groups that are using up a lot of storage space owing to high level of email/file activity.
Note:
This test uses the Microsoft Graph API. Tests that use Microsoft Graph API may not start reporting metrics right away. Sometimes, they may go without reporting metrics for over 48 hours. This is normal behavior, and it occurs because, Microsoft does not collect/refresh the metrics as frequently as the test executes.
Target of the test : Office 365
Agent deploying the test : A remote agent
Outputs of the test : One set of results for the Office 365 tenant being monitored
| Parameters | Description |
|---|---|
|
Test period |
How often should the test be executed. |
|
Host |
The host for which the test is to be configured. By default, this is portal.office.com |
|
Tenant Name |
Certificate-based authentication (CBA) enables customers to allow or require users to authenticate with X.509 certificates against their Azure Entra ID for applications and browser sign-in. When monitoring highly secure Office 365 environments, you should configure the eG agent to identify itself to a tenant using a valid X.509 certificate, so that it is allowed secure access to the tenant and its resources. To achieve this, you should do the following:
|
|
Graph Client ID, Graph Client Secret |
This test pulls metrics by accessing the Microsoft Graph API. Therefore, for this test to run, the Microsoft Graph App should first be registered on Microsoft Entra ID, with a specific set of permissions. To know what these permissions are and which tests require these permissions, refer to eG Tests Requiring Microsoft Graph App Permissions.
This App can be created manually or using the proprietary PowerShell script that eG Enterprise provides. For the manual procedure, refer to Registering the Microsoft Graph App On Microsoft Entra ID. To use the PowerShell script, refer to Automatically Fulfilling Pre-requisites For Monitoring Microsoft Office 365 Environments. To allow this test access to Microsoft Graph App, you need to configure the test with the Graph Client ID and Graph Client Secret of the registered application. The Client ID is a unique identifier for your application, while the Client Secret is a confidential string used to verify your application's identity to access protected resources. If you have manually registered the app in Microsoft Entra ID, then steps 5 and 6 of the procedure detailed in the Registering the Microsoft Graph App On Microsoft Entra ID topic will lead you to the Client ID and Client Secret of the app. Make a note of these details and use them to configure the Graph Client ID and Graph Client Secret parameters, respectively. On the other hand, if you have used eG's proprietary pre-requisites script to automatically create the Microsoft Graph app, then, step 13 of the procedure detailed in the Automatically Fulfilling Pre-requisites For Monitoring Microsoft Office 365 Environments topic will provide you with the Client ID and Client Secret of the graph app. Make a note and configure the Graph Client ID and Graph Client Secret parameters accordingly. |
|
Graph Scope, Graph Authority |
This test pulls metrics by accessing the Microsoft Graph API. Therefore, for this test to run, a Microsoft Graph App should first be registered on Microsoft Entra ID, with a specific set of permissions. To know what these permissions are and which tests require these permissions, refer to eG Tests Requiring Microsoft Graph App Permissions.
This App can be created manually or using the proprietary PowerShell script that eG Enterprise provides. For the manual procedure, refer to Registering the Microsoft Graph App On Microsoft Entra ID. To use the PowerShell script, refer to Automatically Fulfilling Pre-requisites For Monitoring Microsoft Office 365 Environments. To interact with the Graph API and gather the required performance statistics, the eG agent running this test requires an access token. The SCOPE and AUTHORITY parameters within the access token are crucial for defining the scope of access and the authentication context, respectively. SCOPE specifies what resources the eG agent running this test can access, while AUTHORITY identifies the authentication provider. The Graph Scope and Graph Authority parameters of this test capture the SCOPE and AUTHORITY definitions (respectively) in the eG agent's access token. By default, the Graph Scope parameter is set to https://graph.microsoft.com/.default. This is a common SCOPE for Microsoft Graph, allowing the eG agent to access all permissions that have been granted to the registered Microsoft Graph app within the Microsoft Entra ID. You can change this to match the SCOPE defined for the eG agent in your organization. Similarly, the Graph Authority is set to https://login.microsoftonline.com/ by default. In this case, the tenant name or ID you specify against the Tenant Name parameter will be automatically appended to https://login.microsoftonline.com to complete the URL and set the default Graph Authority - i.e., https://login.microsoftonline.com/<Tenant_Name/ID>. This default setting indicates that Microsoft Entra ID will handle the authentication and authorization process. |
|
Domain, Domain User Name, Domain Password, and Confirm Password |
These parameters are applicable only if the eG agent needs to communicate with the Office 365 portal via a Proxy server. In this case, in the Domain text box, specify the name of the Windows domain to which the eG agent host belongs. In the Domain User Name text box, mention the name of a valid domain user with login rights to the eG agent host. Provide the password of that user in the Domain Password text box and confirm that password by retyping it in the Confirm Password text box. On the other hand, if the eG agent is not behind a Proxy server, then you need not disturb the default setting of these parameters. By default, these parameters are set to none. |
|
Proxy Host, Proxy Port, Proxy User Name, and Proxy Password |
These parameters are applicable only if the eG agent needs to communicate with the Office 365 portal via a Proxy server. In this case, provide the IP/host name and port number of the Proxy server that the eG agent should use in the Proxy Host and Proxy Port parameters, respectively. If the Proxy server requires authentication, then specify the credentials of a valid Proxy user against the Proxy User Name and Proxy Password text boxes. Confirm that password by retyping it in the Confirm Password text box. If the Proxy server does not require authentication, then specify none against the Proxy User Name, Proxy Password, and Confirm Password text boxes. On the other hand, if the eG agent is not behind a Proxy server, then you need not disturb the default setting of any of the Proxy-related parameters. By default, these parameters are set to none. |
|
Report Date Format |
The eG agent running this test pulls date/time information from Microsoft Graph reports in Office 365 and displays the same as part of detailed diagnosis. yyyy-MM-dd is the default format in which Microsoft Graph reports date values. Accordingly, the Report Date Format parameter too is set to yyyy-MM-dd by default. If you change the date format for Microsoft Graph reports in Office 365, then you can change the value of this parameter as well. |
|
Show Top N DD |
By default, the detailed diagnosis of this test displays the details of only the top-10 groups, in terms of their usage of mailbox storage. Accordingly, this flag is set to 10 by default. If you want, you can change the value of this parameter, so that detailed diagnosis displays records pertaining to more number of groups or fewer. |
|
DD Frequency |
Refers to the frequency with which detailed diagnosis measures are to be generated for this test. The default is 1:1. This indicates that, by default, detailed measures will be generated every time the test runs, and also every time the test detects a problem. You can modify this frequency, if you so desire. Also, if you intend to disable the detailed diagnosis capability for this test, you can do so by specifying none against DD Frequency. |
|
Detailed Diagnosis |
To make diagnosis more efficient and accurate, the eG Enterprise embeds an optional detailed diagnostic capability. With this capability, the eG agents can be configured to run detailed, more elaborate tests as and when specific problems are detected. To enable the detailed diagnosis capability of this test for a particular server, choose the On option. To disable the capability, click on the Off option. The option to selectively enabled/disable the detailed diagnosis capability will be available only if the following conditions are fulfilled:
|
| Measurement | Description | Measurement Unit | Interpretation |
|---|---|---|---|
|
Yammer liked messages |
Indicates the number of messages on yammer that were liked by group members. |
Number |
|
|
Yammer posted messages |
Indicates the number of messages posted to yammer by group members. |
Number |
|
|
Yammer read messages |
Indicates the number of messages posted to yammer that were read by group members. |
Number |
|
|
Mailbox storage used by groups |
Indicates the amount of mailbox storage space used by groups. |
GB |
A consistent increase in the value of this measure is indicative of a steady increase in mailbox storage usage, probably caused by excessive mail activity across groups. In the event that the value of this measure is abnormally high, use the detailed diagnosis of this measure to identify which groups are draining mailbox storage. |
|
Mailbox items in group |
Indicates the total number of items in the mailboxes of group members. |
Number |
A consistent increase in the value of this measure is indicative of a steady increase in email activity in the groups. If the value of this measure is abnormally high, use the detailed diagnosis of this measure to identify which groups with many items in their mailbox, and who owns these groups. |
|
Mails received |
Indicates the number of emails received across groups. |
Number |
Use the detailed diagnosis of this measure to identify which groups received the maximum number of mails. |
|
SharePoint files |
Indicates the number of SharePoint files used by group members. |
Number |
Use the detailed diagnosis of this measure to identify which groups use the maximum number of SharePoint files. |
|
SharePoint site storage used |
Indicates the total amount of site storage space used by groups. |
GB |
A consistent increase in the value of this measure is indicative of a steady increase in site storage usage, probably caused by by the creation of many SharePoint files or a few/more large-sized SharePoint files by group members. In the event that the value of this measure is abnormally high, use the detailed diagnosis of this measure to identify which groups are hogging site storage. |
|
SharePoint active files |
Indicates the total number of SharePoint files actively used by group members. |
Number |
Use the detailed diagnosis of this measure to know which groups are actively using the maximum number of SharePoint files. |
The detailed diagnosis of the Mailbox storage used by groups measure reveals the top-10 groups consuming the maximum mailbox storage space. This will point administrators to those groups that are contributing to the excessive usage of mailbox storage.
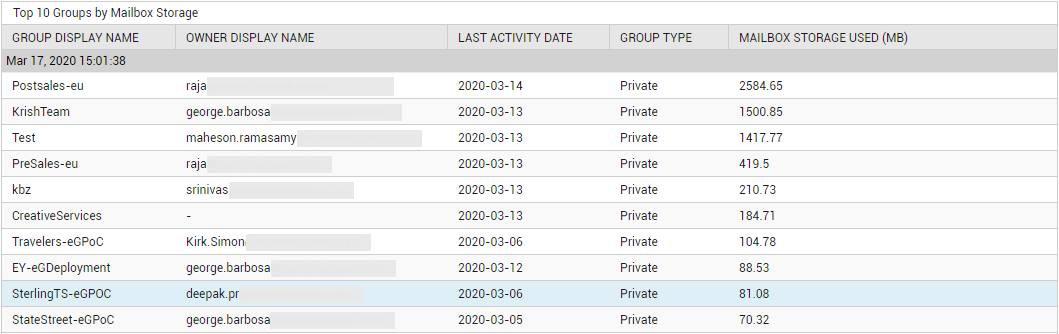
Figure 1 : The detailed diagnosis of the Mailbox storage used by groups measure
The detailed diagnosis of the Mailbox items in groups measure reveals the top-10 groups, in terms of the count of items in their mailbox. With the help of these detailed metrics, administrators can quickly identify which groups are draining mailbox storage by adding many items to it.
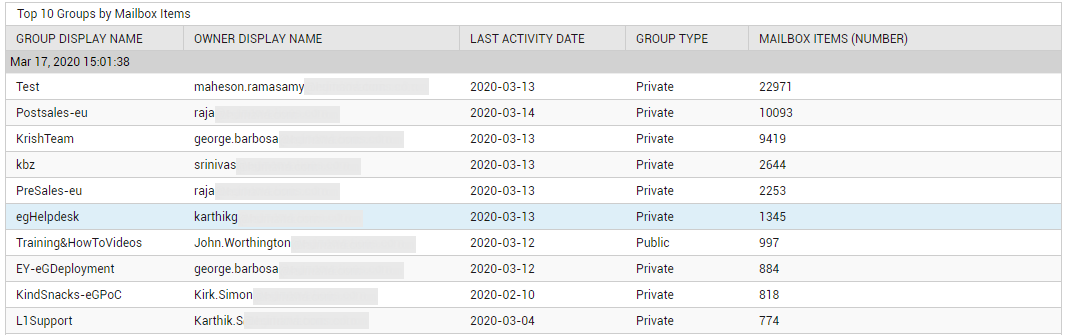
Figure 2 : The detailed diagnosis of the Mailbox items in groups measure
The detailed diagnosis of the Mails received measure reveals the top-10 groups, in terms of mails received. If mailbox storage usage is unusually high across groups, then you can use these detailed metrics to identify which group received and stored the maximum number of mails in the mailbox storage, thereby causing excessive consumption of storage space.
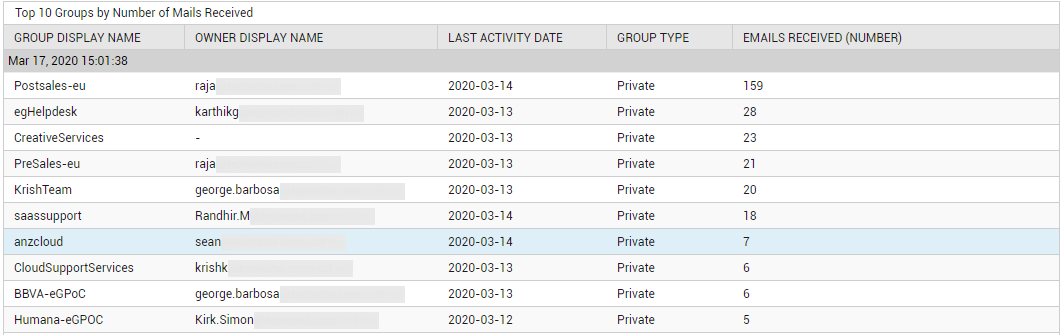
Figure 3 : The detailed diagnosis of the Mails received measure
The detailed diagnosis of the SharePoint files measure lists the top-10 groups, with the maximum number of SharePoint files. If there is abnormal usage of site storage, then you can use these detailed metrics to identify the group that could be contributing to this by storing many SharePoint files.
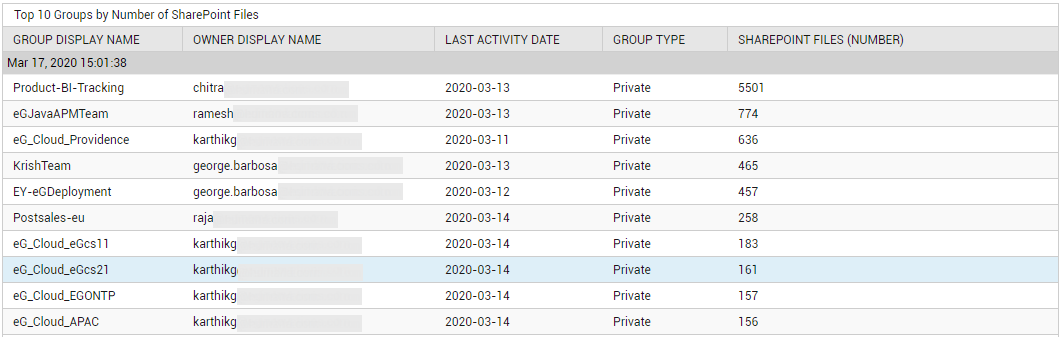
Figure 4 : The detailed diagnosis of the SharePoint files measure
The detailed diagnosis of the SharePoint site storage used measure lists the top-10 groups consuming the maximum space in site storage. If groups appear to be using site storage excessively, then these detailed statistics will point you to the precise group that is responsible for the anomaly.
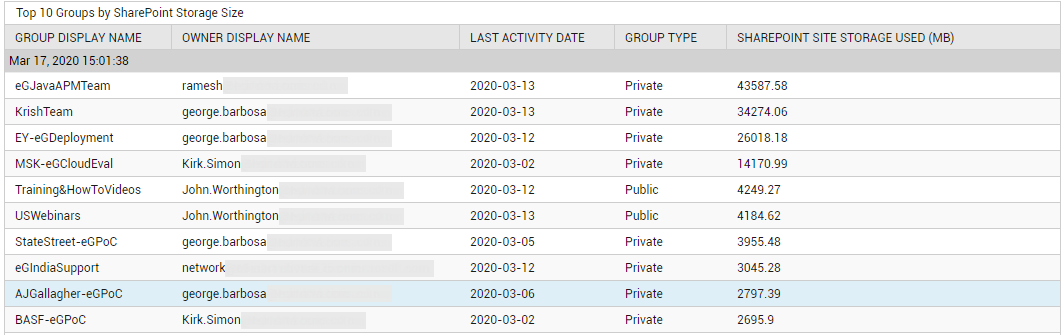
Figure 5 : The detailed diagnosis of the SharePoint site storage used
The detailed diagnosis of the SharePoint active files measure lists the top-10 groups, in terms of the number of active SharePoint files. With the help of these detailed metrics, you can identify which group is responsible for abnormal storage usage.
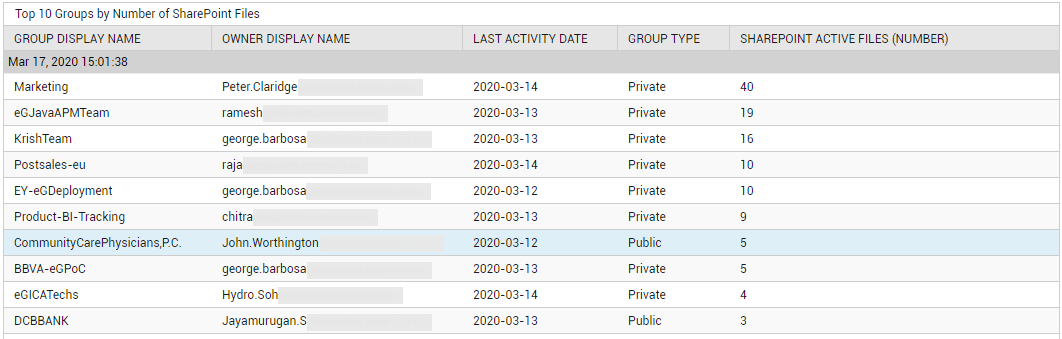
Figure 6 : The detailed diagnosis of the SharePoint active files measure