Monitoring the WebLogic Server Ver. 9.0 (and above)
The special WebLogic monitoring model (see Figure 15) that eG Enterprise offers provides uses JMX (Java Management extension), the new standard for managing java components, for monitoring the WebLogic server 9.0 (and above). JMX allows users to instrument their applications and control or monitor them using a management console. Using this mechanism, over a hundred critical metrics relating to a WebLogic server instance can be monitored in real-time and alerts can be generated based on user-defined thresholds or auto-computed baselines.
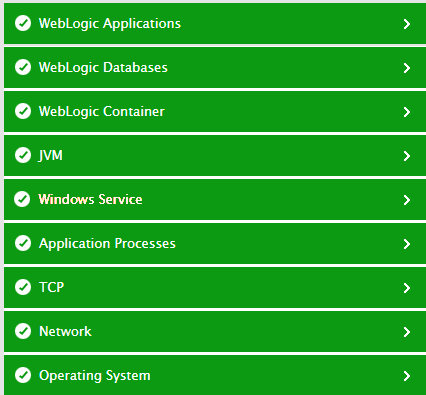
Figure 15 : Layer model of the WebLogic Application server
The bottom 3 layers of the WebLogic server are similar to that of the Windows Generic Server model. These layers have been elaborately discussed in Unix and Windows Servers section.