Detailed Diagnostics Revealing that a Remote HTTP Call is the Reason Why a Transaction Slowed Down
If the Avg response time measure of the PHP Business Transactions test reports an abnormally high value for a grouped URL, you can click on the magnifying glass icon alongside the measure (in the Layers tab page of the eG monitoring console) to invoke detailed diagnostics revealing which specific URLs in the group are slow (see Figure 1).
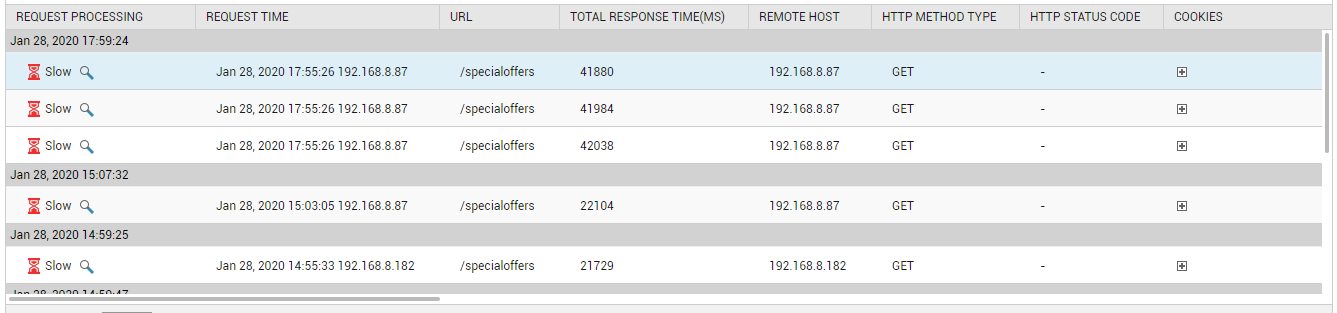
Figure 1 : The detailed diagnosis of the Avg response time measure of a grouped URL
To drill down to the source of the slowness of any of these transactions, click on the ‘magnifying glass’ icon alongside the ‘Slow’ icon in Figure 1.
Figure 2 will then appear depicting how the transaction flows. From Figure 2, it is clear that an HTTP call made by the Apache web server, PHP_BTM:8055, to another Apache web server in the backend is slowing down the transaction.
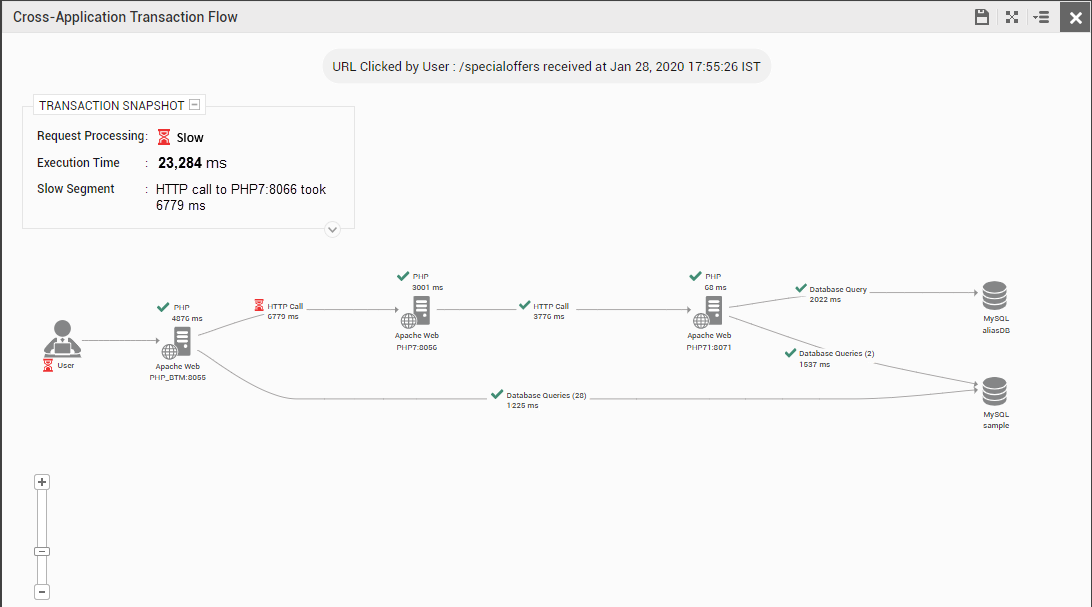
Figure 2 : Cross-application transaction flow depicting that the problem is with the HTTP call
To know more about this call, click on HTTP Call in Figure 2. A Remote Call Details window will then open listing all the remote calls made by the Apache web server, PHP_BTM:8055. From this window you can infer that the HTTP call made to the backend Apache web server is consuming over 75% of the transaction execution time. As you can see, a few quick mouse clicks from a Slow transaction in Figure 1 has lead you to the precise HTTP call that is delaying the transaction.
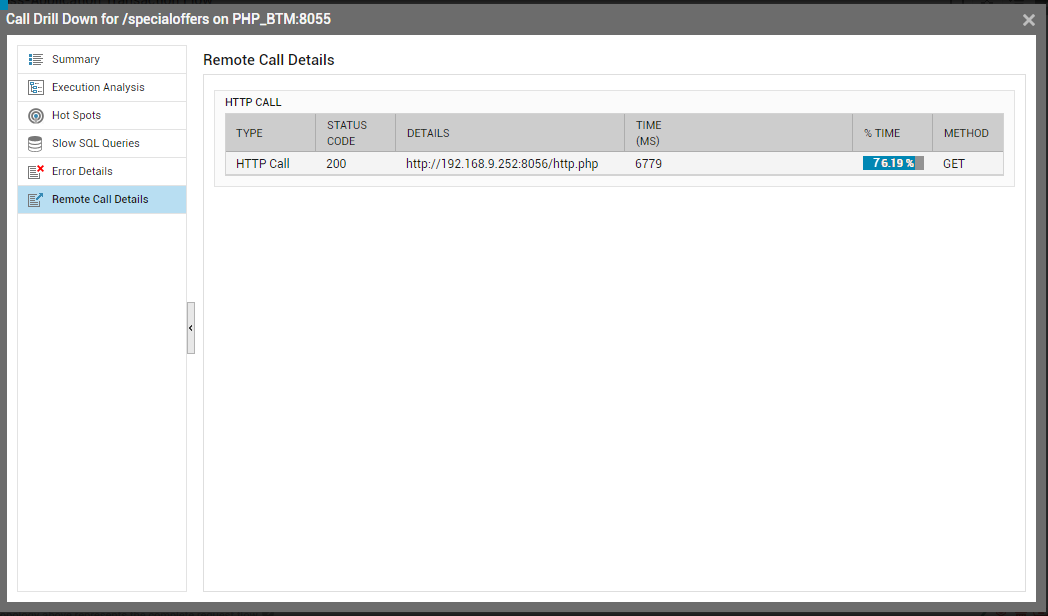
Figure 3 : List of remote service calls made by the PHP_BTM:8055 server