How to Monitor Redis Using eG Enterprise?
To monitor Redis using eG Enterprise, follow the broad steps outlined below:
-
Manage the Redis server;
-
Configure tests for the Redis server;
Each of these broad steps are discussed elaborately below.
Managing the Redis Server
eG Enterprise employs a novel port-scanning technique to automatically discover the Redis server using a novel port-scanning technique. To auto-discover a Redis server that listens on its default port (6379) and to manage that discovered server, do the following:
-
Login to the eG admin interface.
-
Follow the Infrastructure -> Discovery menu sequence.
-
In the DISCOVERY tree that you will see in the page that appears next, follow the node sequence, Discovery -> Manager Discovery -> Settings -> General.
-
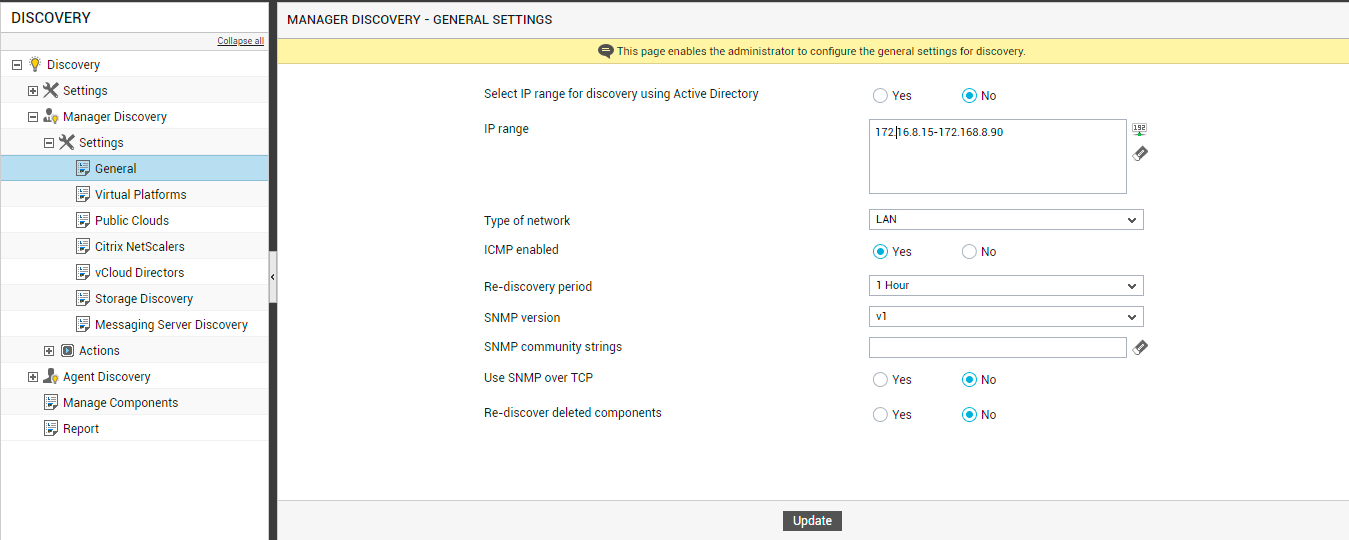
A MANAGER DISCOVERY - GENERAL SETTINGS page will then appear in the right panel (see Figure 1).
-
Against IP range in Figure 1, specify the IP range that includes the Redis server to be auto-discovered. Then, click the Update button to start discovery.
-
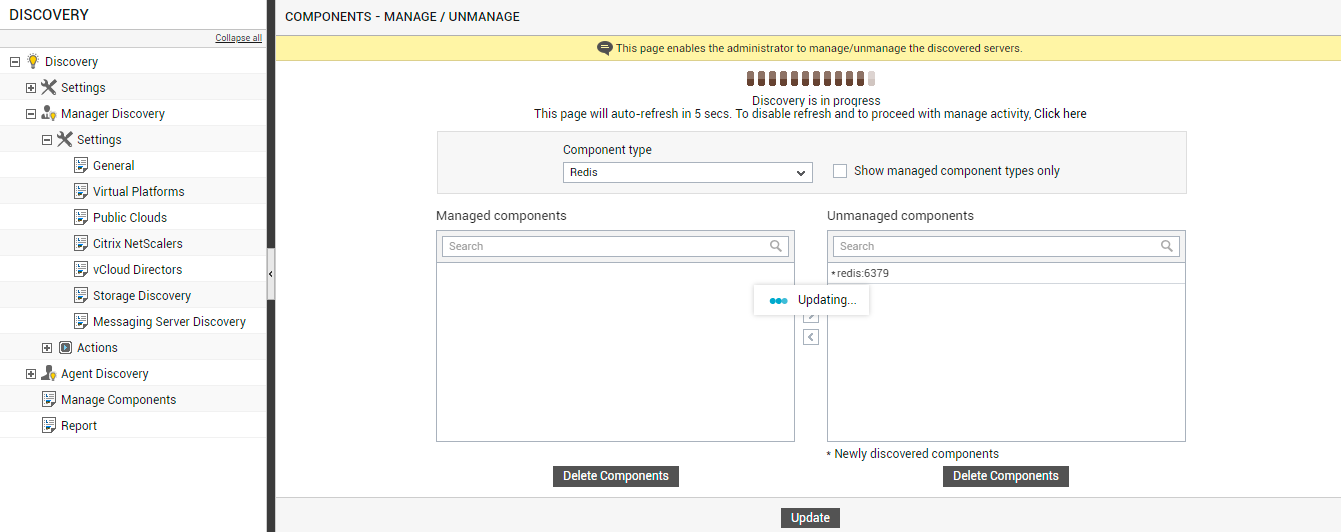
Figure 2 will then appear, where you can track the progress of the discovery process. As and when components are auto-discovered, the Component type list in Figure 2 will get automatically populated with the component types of the servers that are auto-discovered. Once eG Enterprise discovers the Redis server, you will find the component type Redis displayed in the Component type list. Select that type. The Unmanaged components list box will then display the Redis server that is auto-discovered.
-
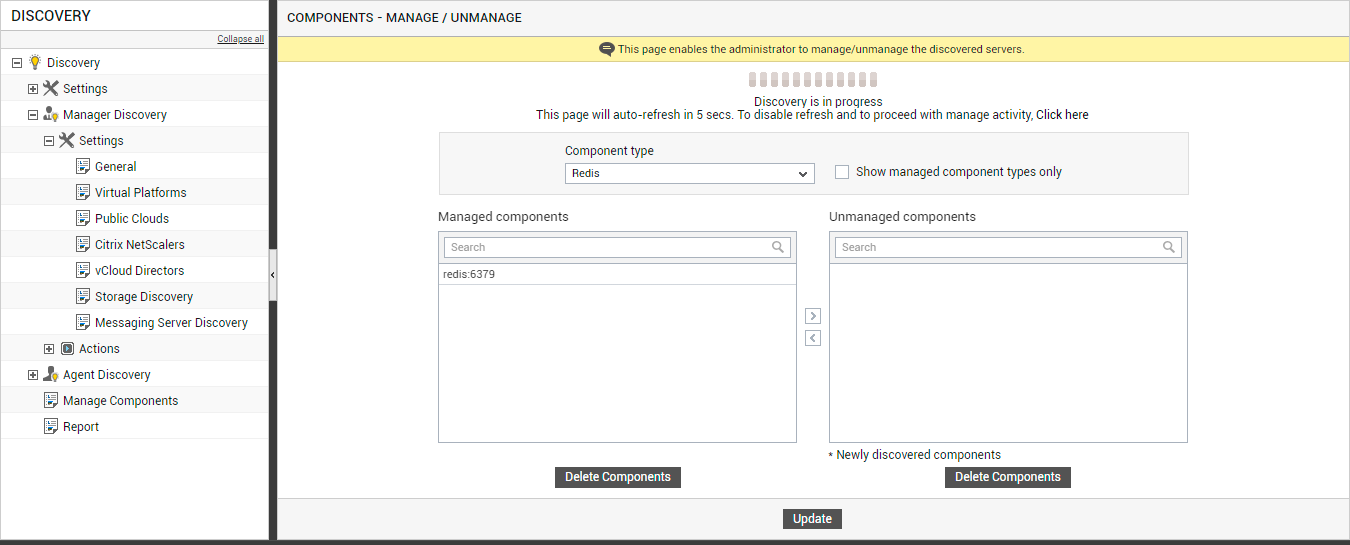
Select the discovered Redis server from the Unmanaged component list and click the < button to manage it. Doing so will shift the selection to the Managed components list (see Figure 3).
-
Finally, click the Update button.
If for some reason the Redis server is not automatically discovered, you can manually add the server to the eG Enterprise system. For this, do the following:
-
Login to the eG admin interface.
-
Follow the Infrastructure -> Components -> Add/Modify menu sequence.
-
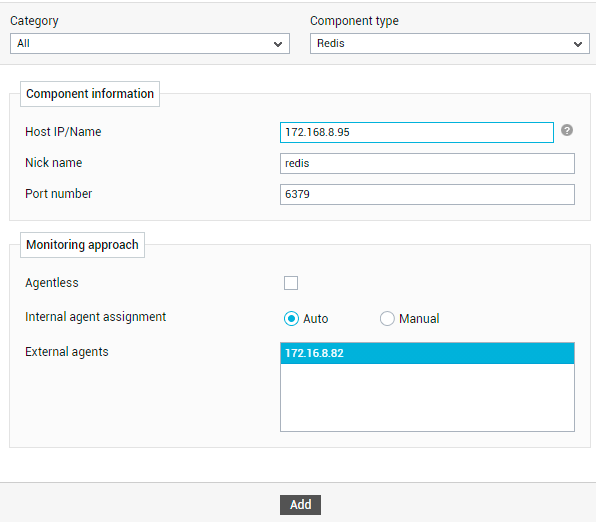
In the page that appears, select Redis as the Component type and click the Add New Component button. Figure 4 will then appear.
-
In Figure 4, specify the Host IP/Name of the Redis server and assign a unique Nick name to it. Then, assign one/more External agents to the target server and click the Add button to add the server.
Configuring Tests
Once the Redis server is managed/added, proceed to configure tests for the server. For that, do the following:
-
Follow the Infrastructure -> Components -> Add/Modify menu sequence in the eG admin interface.
-
In the page that appears next, select Redis as the Component type. The Redis server that you recently managed/added will then be listed therein. To configure tests for that server, click on the
 icon corresponding to it (see Figure 5).
Figure 5 : Clicking on the Configure Tests icon corresponding to a managed Redis server
-
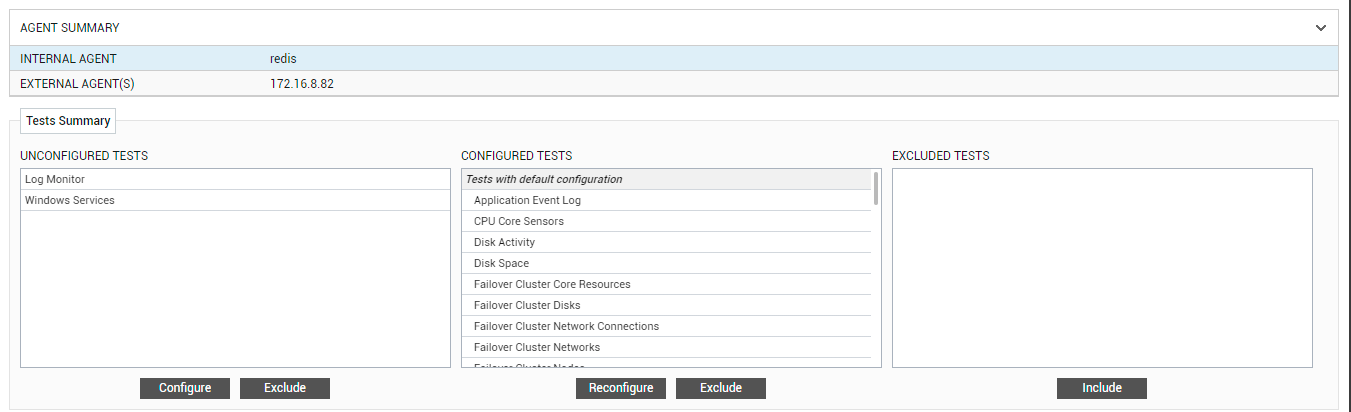
Figure 6 will then appear. From the UNCONFIGURED TESTS list in Figure 6, select the test that you want to configure. Say, you select the Log Monitor test for configuration. Once you select the test, click the Configure button in Figure 6 to configure it.
-
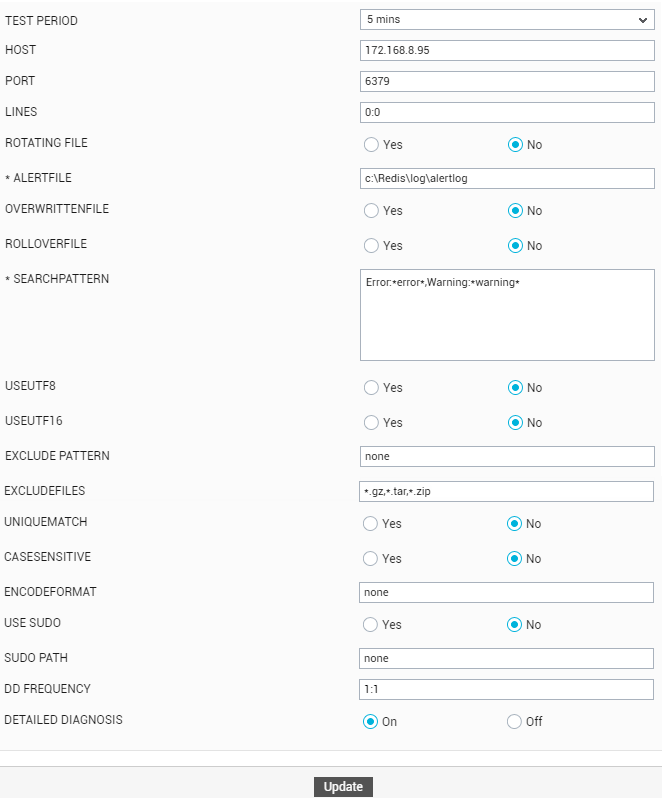
Figure 7 will then appear, using which you can configure the parameters for the Log Monitor test.
-
The Log Monitor test periodically scan Redis logs for errors/warnings of specified patterns, and reports the count and details of errors/warnings that match the configured patterns. To know how to configure this test, refer to Log Monitor Test in the Monitoring Unix and Windows servers
-
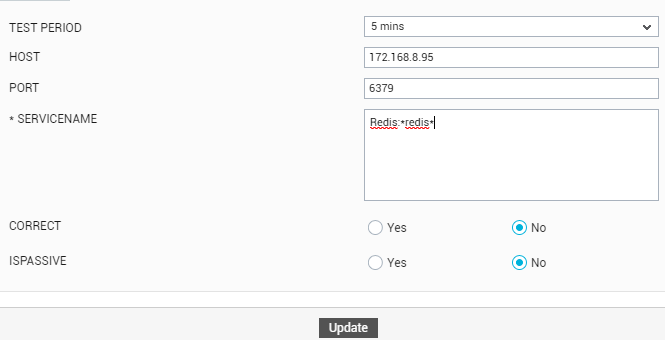
Finally, click the Update button. This will transfer the Log Monitor test to the CONFIGURED TESTS list in Figure 6. Next, select the Windows Services test in the UNCONFIGURED TESTS list of Figure 6 for configuration. Figure 8 will then appear.
-
The Windows Services test checks the availability of the service that corresponds to the Redis server and alerts if that service is not running. To know how to configure this test, refer to
-
Finally, click the Update button.
Now that the tests are configured, log into the eG monitoring console to view the metrics reported by the tests.