Capacity Analysis for Virtual Applications Report
Load balancing and capacity planning are critical requirements for Citrix administrators. The main challenge of the Citrix administrators lies in supporting more users per Citrix XenApp server with minimal server resources. The Citrix XenApp capacity planning report answers many key questions:
- Based on the average resource consumption per session, how many more concurrent sessions are possible?
- How are sessions load-balanced across servers?
- Is the server capacity bottlenecked by resource usage?
- How many more sessions can be supported after increasing resource capacity?
To generate this report, do the following:
- Follow the menu sequence: REPORTS BY FUNCTION -> Domain-specific Reports -> Virtual Applications / Desktops (Citrix XenApp / XenDesktop)
-
Figure 1 will then appear.
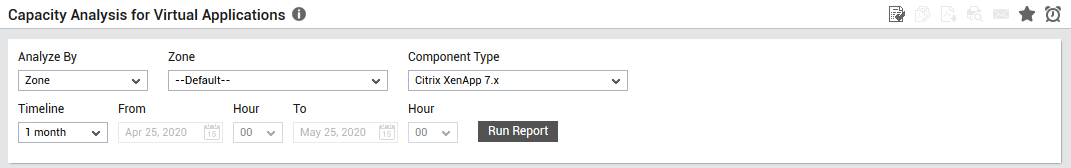
Figure 1 : Generating a Capacity Analysis for Virtual Applications report
-
In Figure 1 that appears, select a criterion for analysis from the Analyze By list box. Using this report, you can analyze the capacity of one/more components that are managed in your virtual environment, or those that are part of a zone. The options provided by the Analyze By list box are discussed hereunder:
- Component: Select this option to choose the component(s) from across all the managed components in the environment.
- Zone: Pick this option for a report on the capacity analysis of virtual components that are included in a zone. Then, choose a Zone.
- From the Component Type list, select the component type for which the report is to be generated.
- Select the component from the Component list for which the report is to be generated.
-
Then, specify the Timeline for generating the report. You can either provide a fixed time line such as 1 hour, 2 days, etc., or select the Any option from the list to provide a From and To date/time for report generation. By default, the Timeline for generating this report is set to 1 month.
Note:
For every user registered with the eG Enterprise system, the administrator can indicate the maximum timeline for which that user can generate a report. Once the maximum timeline is set for a user, then, whenever that user logs into eG Reporter and attempts to generate a report, the Timeline list box in the report page will display options according to the maximum timeline setting of that user. For instance, if a user can generate a report for a maximum period of 3 days only, then 3 days will be the highest option displayed in the Timeline list - i.e., 3 days will be the last option in the fixed Timeline list. Similarly, if the user chooses the Any option from the Timeline list and proceeds to provide a start date and end date for report generation using the From and To specifications, eG Enterprise will first check if the user's Timeline specification conforms to his/her maximum timeline setting. If not, report generation will fail. For instance, for a user who is allowed to generate reports spanning over a maximum period of 3 days only, the difference between the From and To dates should never be over 3 days. If it is, then, upon clicking the Run Report button a message box will appear, prompting the user to change the From and To specification.
-
In addition to the settings discussed above, this report comes with a set of default specifications. These settings are hidden by default. If you do not want to disturb these default settings, then you can proceed to generate the report by clicking the Run Report button soon after you pick a Cluster. However, if you want to view and then alter these settings (if required), click on the
 button. The default settings will then appear in the MORE OPTIONS drop don window (see Figure 2). The steps below discuss each of these settings and how they can be customized.
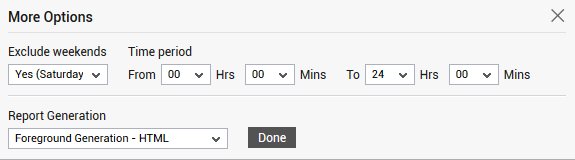
Figure 2 : The default settings for generating the Capacity Analysis for Virtual Applications report
-
If the timeline specified for the report needs to exclude the data collected during the Weekends, then set Exclude weekends to Yes. If not, select No.
Note:
By default, the weekend constitutes Saturday and Sunday. To override this default setting, do the following:
- Edit the eg_report.ini file in the <eg_install_dir>\manager\config directory.
- In the [virtual_cluster] section of the file, the EXCLUDE_WEEKEND parameter is set to Saturday,Sunday by default. You can modify this by setting the exclude_weekend parameter to a comma-separated list of other days of the week - say Friday,Saturday.
- Save the file after making the required changes.
- Next, indicate the report Timeperiod.
-
In large environments, reports generated using months of data can take a long time to complete. Administrators now have the option of generating reports on-line or in the background. When a report is scheduled for background generation, administrators can proceed with their other monitoring, diagnosis, and reporting tasks, while the eG manager is processing the report. This saves the administrator valuable time. To schedule background processing of a report, you can either select the Background Save - PDF option or the Background Save - CSV option from the Report Generation list. In this case, a Report Name text box will appear, where you would have to provide the name with which the report is to be saved in the background. To process reports in the foreground, select the Foreground Generation - HTML option from this list.
Note:
- The Report Generation list will appear only if the EnableBackgroundReport flag in the [BACKGROUND_PROCESS] section of the eg_report.ini file (in the {EG_INSTALL_DIR}\manager\config directory) is set to Yes.
- The default selection in the Report Generation list will change according to the Timeline specified for the report. If the Timeline set is greater than or equal to the number of days specified against the MinDurationForReport parameter in the [BACKGROUND_PROCESS] section of the eg_report.ini file, then the default selection in the Report Generation list will be Background Save - PDF. On the other hand, if the Timeline set for the report is lesser than the value of the MinDurationForReport parameter, then the default selection in the Report Generation list will be Foreground. This is because, the MinDurationForReport setting governs when reports are to be processed in the background. By default, this parameter is set to 2 weeks - this indicates that by default, reports with a timeline of 2 weeks and above will be processed in the background.
- Click the Done button if any changes were made to the More Options drop down window.
-
Finally, click the Run Report button. Figure 3 will then appear.
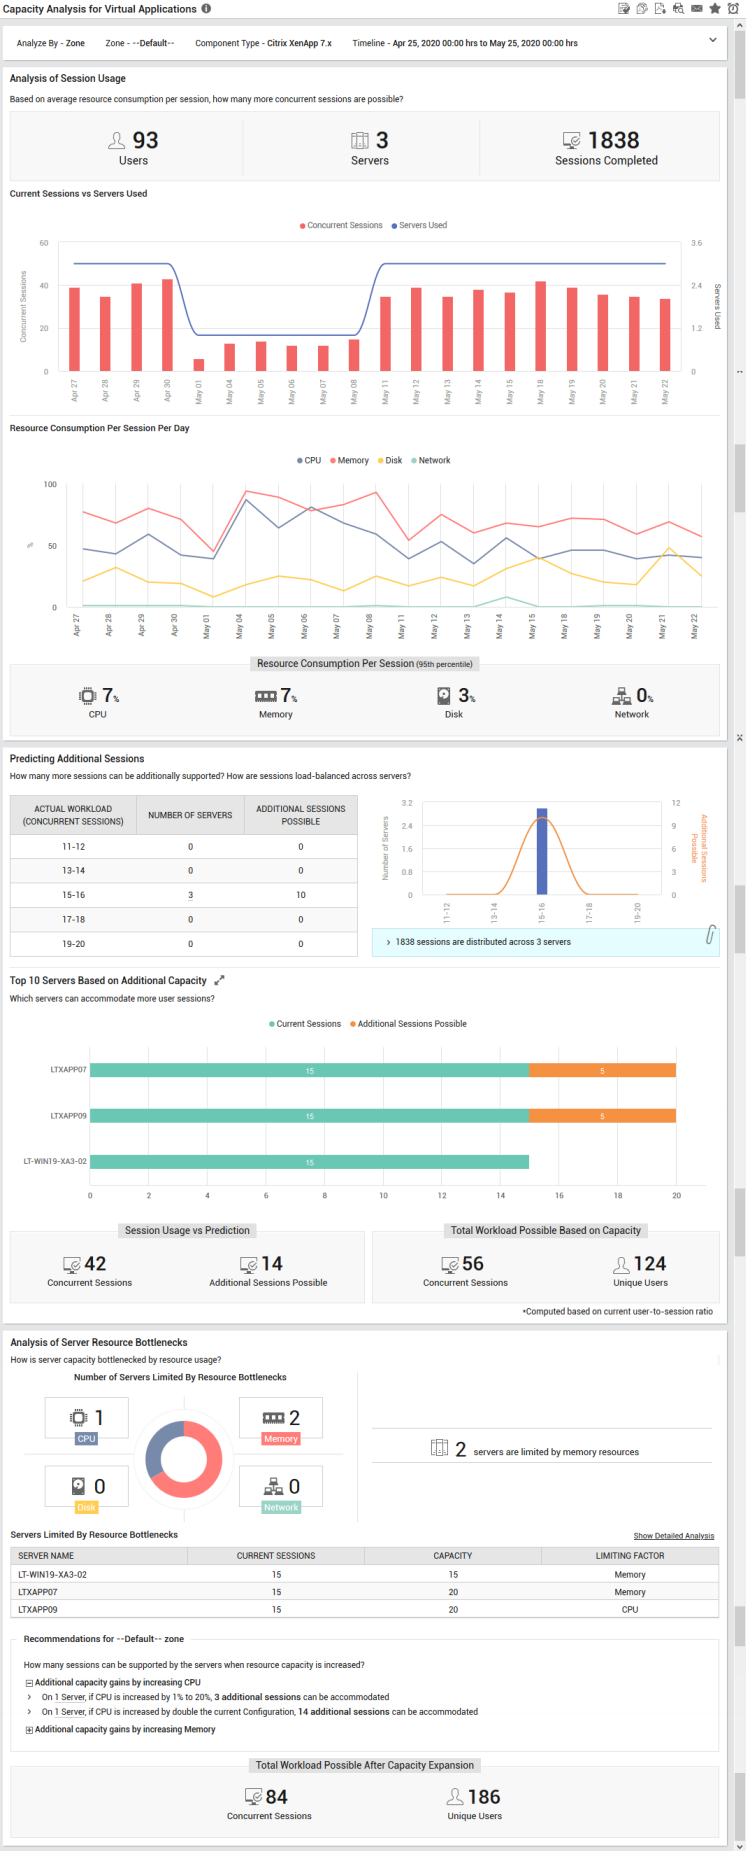
Figure 3 : The Capacity Analysis for Virtual Applications report
-
The generated report in Figure 3 comprises of the following sections:
- The Analysis of Session Usage section helps administrators determine how many more concurrent sessions are possible based on the average resource consumption per session. At a single glance, administrators can figure out the current workload (Users and Sessions Completed) and the count of Servers used. From the Concurrent Sessions vs Servers Used graph, you can infer day-wise statistics of the concurrent sessions and figure out if the servers are utilized to the maximum or if servers can accommodate additional sessions. The Resource Consumption Per Session Per Day graph helps administrators in tracking the resource consumption trends over a period of time. The Resource Consumption Per Session section reveals the 95th percentile value of the resources consumed per session.
- Based on extrapolation of certain historical resource usage patterns, the Predicting Additional Sessions section reveals a table using which administrators can view how sessions are load balanced across all servers. A graphical representation on how many more additional sessions are possible is shown alongside the table for easy understanding. The Top 10 Servers Based on Additional Capacity bar graph reveals the count of concurrent sessions on each server and the count of additional sessions that can be accommodated on the server. By default, eG Enterprise performs an inbuilt current user to session ratio analysis to predict how many more additional sessions are possible. The Session Usage vs Prediction section reveals the count of Concurrent Sessions and the count of Additional Sessions Possible. The Total Workload Possible Based on Capacity section reveals the count of Concurrent Sessions that are possible based on the current capacity and how many more unique users can be accommodated on the servers.
- The Analysis of Server Resource Bottlenecks section reveals how many servers are bottlenecked by resource usage and which type of resource is causing bottlenecks often. The Servers Limited BY Resource Bottlenecks table lists the servers and the actual resource that is causing the bottleneck. The Show Detailed Analysis link will display a detailed tabular analysis with the projected resource utilization on the servers. Recommendations are also offered based on the detailed analysis.
- The Recommendations for section will provide actionable recommendations for increasing the resource capacity so that more user sessions can be supported. The Total Workload Possible After Capacity Expansion section lists how many more concurrent sessions and unique users can be supported after increasing the resource capacity based on the recommendations.
- On the other hand, if the Background Save - PDF option is chosen from the Report Generation list, then clicking on the Run Report button will not generate the report and display it in this page for your benefit. Instead, a message indicating that the report is being processed in the background will appear. This will be accompanied by a link that will lead you to the page that lists all the reports that are being processed in the background, and their current status. If background report generation fails for a report, you can regenerate that report using this page, or can even delete that report if need be. On the other hand, if background processing successfully completes for your report, then, you can view a PDF of the report by clicking on the
 icon in that page.