Endpoint Resource Analytics Report
This report provides deep insights into the resource utilization of the IGEL Endpoints over a period of time. Using this report, the administrators can easily figure out the following:
- How well the memory of each IGEL Endpoint has been utilized? Are adequate memory resources available?
- Is there a sporadic rise in TCP connections to the IGEL Endpoints?
- How well the disk of each IGEL Endpoint is utilized? Is the disk activity consistent or is there sporadic spikes in the disk activity of each IGEL Endpoint?
- Is the IGEL Endpoint experiencing frequent downtime? How long has the IGEL Endpoint been down over a period of time?
To generate the Endpoint Resource Analytics report, do the following:
- Select the Endpoint Resource Analytics option by following the menu sequence: REPORTS BY FUNCTION -> Domain-specific Reports -> IGEL Reports.
-
Figure 1 will then appear.

Figure 1 : Specifying the criteria for generating the Endpoint Resource Analytics report
-
When Figure 1 appears, first indicate the Report Type to be generated. By default, Graph option will be chosen from this list indicating that this report will graphically represent the resource utilization of the IGEL Endpoints. However, if you wish to generate the report in a tabular format, pick the Data option from this list.
- Next, choose a Component Type. By default, IGEL Endpoints will be chosen from this list. The Components list is then populated with the components pertaining to the chosen Component Type. If the Components list consists of too many components, then viewing all the components and selecting the ones you need for report generation could require endless scrolling. To avoid this, you can click the
 button next to the Components list. The COMPONENTS pop up window will then appear using which you can view almost all the components in a single interface and Select the ones for which the report is to be generated. You can narrow your search further by using the Search text box. Specify the whole/part of the component name to search for in this text box, and click the
  icon next to it.
 - Then, pick an IGEL Endpoint for which the report is to be generated from the IGEL Endpoints list.
- Pick an option from the Measure Group list box for which the report is to be generated. By default, this report enables you to figure out the Memory utilization, TCP connection rate, Disk Activity and Uptime of the chosen IGEL Endpoint. By default, the Memory usage option will be chosen from this list. If you wish to generate the report based on all the criteria listed in the Measure Group list, then, pick the All option.
- By default, the check box preceding the Show Legends field will be checked indicating that the legends will be displayed when you hover over the graph that is generated as part of the report. If you do not wish to view the legends upon hovering over the graph, you can uncheck this check box.
-
Then, specify the Timeline for generating the report. You can either provide a fixed time line such as 1 hour, 2 days, etc., or select the Any option from the list to provide a From and To date/time for report generation.
Note:
For every user registered with the eG Enterprise system, the administrator can indicate the maximum timeline for which that user can generate a report. Once the maximum timeline is set for a user, then, whenever that user logs into eG Reporter and attempts to generate a report, the Timeline list box in the report page will display options according to the maximum timeline setting of that user. For instance, if a user can generate a report for a maximum period of 3 days only, then 3 days will be the highest option displayed in the Timeline list - i.e., 3 days will be the last option in the fixed Timeline list. Similarly, if the user chooses the Any option from the Timeline list and proceeds to provide a start date and end date for report generation using the From and To specifications, eG Enterprise will first check if the user's Timeline specification conforms to his/her maximum timeline setting. If not, report generation will fail. For instance, for a user who is allowed to generate reports spanning over a maximum period of 3 days only, the difference between the From and To dates should never be over 3 days. If it is, then, upon clicking the Run Report button a message box will appear, prompting the user to change the From and To specification.
-
In addition to the settings discussed above, this report comes with a set of default specifications. These settings are hidden by default. If you do not want to override these default settings, then you can proceed to generate the report by clicking the Run Report button soon after you pick one/more components for report generation. However, if you want to view and then alter these settings (if required), click on the
 icon. The default settings will then appear in the MORE OPTIONS drop down window (See Figure 2). The steps below discuss each of these settings and how they can be customized.
Figure 2 : The default settings for generating the Endpoint Uptime Analytics report
-
The speed with which a report is generated depends primarily on the report Timeline. While a Timeline that varies between a couple of days to a week enables the eG Enterprise system to quickly retrieve the required data, timelines that span multiple weeks/months could slow-down the data retrieval and report generation process to a considerable extent, owing to the volume of data involved. In order to ensure quick and easy access to reports, eG Enterprise provides you the option of enabling data retrieval from the Trend information in the database, instead of the Detailed test information base that is used by default for report generation. The Detailed test information comprises of multiple measurement records for a test - one or more each for every test execution. Whereas, the Trend information includes only hourly, daily, and monthly summary computations for how a test performed on a continuous basis. For instance, during a period of 1 hour, a test that runs every 5 minutes inserts atleast 12 records into the Detailed test information base. On the other hand, the Trend information base would consist of only 1 record for the same 1 hour period. Fewer the number of records, query execution becomes much quicker, and data retrieval faster. To use the trend data for report generation, you will have to select the Trend option from the Show Data field in Figure 2. By default, the Detailed option is selected in Figure 2 indicating that the report data is retrieved from the detailed test information in the database. If need be, you can also ensure that all reports always use the Detailed test tables alone by hiding the Show Data field from the reporter interface. To achieve this, do the following:
-
Login to the eG administrative interface as 'admin'.
-
Select the Manager option from the Settings tile that appears when the button against the Admin tab is clicked.
-
From the GENERAL SETTINGS page that then appears, if you set the Compute average/sum of metrics while trending flag to No, then the Show Data field will not appear in the reporter interface; this denies users access to the Trend option, and thus ensures that reports are always generated using the Detailed tables.
Note:
-
A Trend report will not include the data for the current day since trend data is only computed at the end of the day.
-
If the Trend option is chosen, the time period of the report should be greater than 1 day.
-
The usage of Detailed test tables for generating reports, especially those that span weeks, increases the stress on the eG database, thus resulting in undue delays in report generation. In order to ensure that the database is not choked by such voluminous data requests, you can configure eG Enterprise to automatically "force" the use of the Trend option if the Timeline of a report exceeds a pre-configured duration. To specify this time boundary, do the following:
-
Edit the eg_report.ini file in the <EG_INSTALL_DIR>\manager\config directory.
-
In the [MISC] section of the file, you will find a DetailedTime parameter.
-
Specify the duration (in days) beyond which Detailed reports cannot be generated, against the DetailedTime parameter, and save the eg_report.ini file.
For instance, to make sure that Detailed reports are disallowed for a Timeline of over 2 weeks, set the DetailedTime parameter to 14 and save the file.
Say, subsequently, you attempt to generate a Detailed report for a FixedTimeline of 3 weeks (which is greater than the 14-day limit set in our example). The instant you select the 3 weeks option from the Fixed list box, the Detailed option gets automatically disabled, and the Trend option gets enabled. Similarly, if you specify an AnyTimeline that runs over 14 days, then, upon clicking the Run Report button to generate the report, a message box appears (see Figure 3) informing you that only the Trend option is permitted.
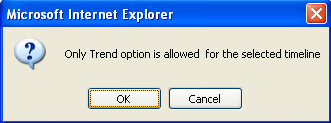
Figure 3 : A message stating that only the Trend option is supported for the given Timeline
To proceed with the Trend report generation, click the OK button in the message box. To terminate Trend report generation, click the Cancel button.
-
-
-
-
If the timeline specified for the report needs to exclude the data collected during the Weekends, then set Exclude weekends to Yes. If not, select No.
Note:
You can configure the days of the week that need to be considered as a ‘weekend’ using the Days parameter in the[EXCLUDE_WEEKEND] section in the eg_report.ini file (in the <EG_INSTALL_DIR>\manager\config directory). The Days parameter is set to Saturday,Sunday by default. To change this weekend specification, enter two other days of the week against the Days parameter.
- Specify the start time and end time for report generation against the Time period field (see Figure 2).
-
In large environments, reports generated using months of data can take a long time to complete. Administrators now have the option of generating reports on-line or in the background. When a report is scheduled for background generation, administrators can proceed with their other monitoring, diagnosis, and reporting tasks, while the eG manager is processing the report. This saves the administrator valuable time. To schedule background processing of a report, you can either select the Background Save - PDF or the Background Save - CSV option from the Report Generation list. In this case, a Report Name text box will appear, where you would have to provide the name with which the report is to be saved in the background. To process reports in the foreground, select the Foreground Generation - HTML option from this list.
Note:
- The default selection in the Report Generation list will change according to the Timeline specified for the report. If the Timeline set is greater than or equal to the number of days specified against the MinDurationForReport parameter in the [BACKGROUND_PROCESS] section of the eg_report.ini file, then the default selection in the Report Generation list will be Background Save - PDF. On the other hand, if the Timeline set for the report is lesser than the value of the MinDurationForReport parameter, then the default selection in the Report Generation list will be Foreground. This is because, the MinDurationForReport setting governs when reports are to be processed in the background. By default, this parameter is set to 2 weeks - this indicates that by default, reports with a timeline of 2 weeks and above will be processed in the background.
- The Report Generation list will appear only if the EnableBackgroundReport flag in the [BACKGROUND_PROCESS] section of the eg_report.ini file (in the [EG_INSTALL_DIR]\manager\config directory) is set to Yes.
- Click the Done button if any changes were made to the More Options drop down window.
-
Finally, click the Run Report button to generate the report.
-
If the option chosen from the Report Type list is Graph, the option chosen from the Measure Group list is Memory usage and the option chosen from the Report Generation list is Foreground Generation - HTML, then clicking the Run Report button will reveal Figure 4.

Figure 4 : The generated Endpoint Resource Analytics report in a graphical representation
From Figure 4, administrators can figure out the following:
- The Memory Usage - IGEL/Total memory (MB) section graphically represents the amount of memory allocated to the IGEL endpoint over a period of time. Using this graph, administrators can easily figure out if the memory allocated to the IGEL endpoint has been increased/reduced during the chosen time period.
- The Memory Usage - IGEL/Used memory(MB) section graphically represents the memory utilized by the chosen IGEL Endpoint over a period of time. Using this graph, administrators can figure out when exactly the IGEL Endpoint has utilized maximum amount of memory. This will further help administrators analyze the reason behind such high utilization of memory resources.
-
If the option chosen from the Report Type list is Data and the option chosen from the Report Generation list is Foreground Generation - HTML, then clicking the Run Report button will reveal Figure 5.

Figure 5 : The generated Endpoint Resource Analytics report in a Data format
-
For every IGEL Endpoint chosen, the generated report (see Figure 5) reveals the memory utilization, uptime and TCP connections established to the Endpoint and the TCP connections established by the IGEL Endpoint. Using this report administrators can figure out the maximum amount of memory utilized by the IGEL Endpoint, the total uptime of the IGEL Endpoint and the rate at which TCP connections were established by the IGEL Endpoint. This will help administrators analyze the resource utilization of each IGEL Endpoint and fine-tune the resources allocated to that Endpoint, if necessary.
-
If the option chosen from the Report Type list is Graph, the option chosen from the Show Data list is Trend and the option chosen from the Report Generation list is Foreground Generation - HTML, then clicking the Run Report button will reveal Figure 6.

Figure 6 : The generated report when Trend option is chosen from the Show Data list
-
If the option chosen from the Report Type list is Graph, the option chosen from the Measure Group list is All and the option chosen from the Report Generation list is Foreground Generation - HTML, then clicking the Run Report button will reveal Figure 7.

Figure 7 : The generated report when All option is chosen from Measure Group list
-
The generated report (see Figure 7) will help administrators figure out the following at a single glance:
-
Memory utilization pattern of the chosen IGEL Endpoint;
-
Patterns noticed in the uptime of the chosen IGEL Endpoint; Using this graph, administrators can figure out how frequently the IGEL Endpoint experienced downtime;
-
The TCP connection rate to the IGEL Endpoint and the rate of TCP Connections established by the IGEL Endpoint; Using this graph, administrators can figure out if there was a sudden/sporadic spike in the TCP connections;
-
The Disk Activity of each IGEL Endpoint; Using the graphs, administrators can figure out when exactly the disk reads and disk writes peaked;
-