Top IGEL Endpoints Report
Use this report to analyze the irregularities in the memory resource consumption of the IGEL Endpoints in a target environment over a period of time. This report also helps you to identify the IGEL Endpoints that consumed too much of disk read/disk write time. Using this report, you can identify those IGEL Endpoints that are causing frequent resource contention in the target environment.
To generate the Top IGEL Endpoints report, do the following:
- Select the IGEL TOP RESOURCE option by following the menu sequence: REPORTS BY FUNCTION -> Domain-specific Reports -> IGEL Reports.
-
Figure 1 will then appear.
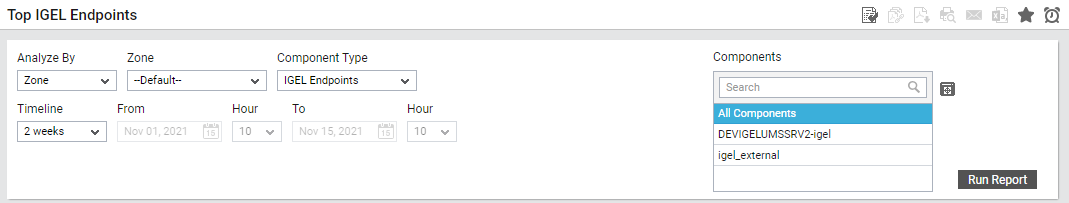
Figure 1 : Specifying the criteria for generating the Top IGEL Endpoints report
-
Select a criterion for analysis from the Analyze By list box. Using this report, you can analyze the performance of one/more components, or those that are part of a zone, service or a segment. The options provided by the Analyze By list box are discussed hereunder:
- Component:Select this option to choose the component(s) from across all the managed components in the environment. For instance, for a report on CPU utilization of on all the managed systems in the environment, select Component from the Analyze By list.
- Service: If the system for which reports are to be generated is involved in the delivery of a particular service, then pick this option from the Analyze By list. Doing so will invoke a Service list from which a service name is to be chosen. Once you pick a service, all systems which are engaged in the delivery of the chosen service, will be displayed as candidates for selection in the Systems list. Select the systems of your choice from this list.
- Segment: If the systems for which a report is to be generated are part of a segment, pick the Segment option from the Analyze By list. Then, select the segment of interest to you from the Segment list. Then, all systems, which are part of the chosen segment, will be displayed in the Systems list for selection. Select the systems of your choice from this list.
- Zone: If the systems for which a report is to be generated is part of a zone, pick the Zone option from the Analyze By list. To include sub-zones also in your search for components, set the Include SubZones flag to Yes. Then, select the zone of interest to you from the Zone list. This will populate the Systems list with the systems that are part of the chosen zone. Select the systems of your choice from this list.
-
Next, choose a Component Type. By default, IGEL Endpoints will be chosen from this list. The Components list is then populated with the components pertaining to the chosen Component Type. If the Components list consists of too many components, then viewing all the components and selecting the ones you need for report generation could require endless scrolling. To avoid this, you can click the
 button next to the Components list. The COMPONENTS pop up window will then appear using which you can view almost all the components in a single interface and Select the ones for which the report is to be generated. You can narrow your search further by using the Search text box. Specify the whole/part of the component name to search for in this text box, and click the
  icon next to it.
 -
Then, specify the Timeline for generating the report. You can either provide a fixed time line such as 1 hour, 2 days, etc., or select the Any option from the list to provide a From and To date/time for report generation.
Note:
For every user registered with the eG Enterprise system, the administrator can indicate the maximum timeline for which that user can generate a report. Once the maximum timeline is set for a user, then, whenever that user logs into eG Reporter and attempts to generate a report, the Timeline list box in the report page will display options according to the maximum timeline setting of that user. For instance, if a user can generate a report for a maximum period of 3 days only, then 3 days will be the highest option displayed in the Timeline list - i.e., 3 days will be the last option in the fixed Timeline list. Similarly, if the user chooses the Any option from the Timeline list and proceeds to provide a start date and end date for report generation using the From and To specifications, eG Enterprise will first check if the user's Timeline specification conforms to his/her maximum timeline setting. If not, report generation will fail. For instance, for a user who is allowed to generate reports spanning over a maximum period of 3 days only, the difference between the From and To dates should never be over 3 days. If it is, then, upon clicking the Run Report button a message box will appear, prompting the user to change the From and To specification.
-
In addition to the settings discussed above, this report comes with a set of default specifications. These settings are hidden by default. If you do not want to override these default settings, then you can proceed to generate the report by clicking the Run Report button soon after you pick one/more components for report generation. However, if you want to view and then alter these settings (if required), click on the
 icon. The default settings will then appear in the MORE OPTIONS drop down window (See Figure 2). The steps below discuss each of these settings and how they can be customized.
Figure 2 : The default settings for generating the Top IGEL Endpoints report
-
By default, Host option is chosen from the Show By list indicating that this report will be generated for each IGEL Endpoints component that is being monitored. However, if you wish to generate this report based on individual IGEL Endpoints hosted in the target environment, then choose IGEL Endpoints option from this list.
-
If the timeline specified for the report needs to exclude the data collected during the Weekends, then set Exclude weekends to Yes. If not, select No.
Note:
You can configure the days of the week that need to be considered as a ‘weekend’ using the Days parameter in the[EXCLUDE_WEEKEND] section in the eg_report.ini file (in the <EG_INSTALL_DIR>\manager\config directory). The Days parameter is set to Saturday,Sunday by default. To change this weekend specification, enter two other days of the week against the Days parameter.
- Specify the start time and end time for report generation against the Time period field (see Figure 2).
-
In large environments, reports generated using months of data can take a long time to complete. Administrators now have the option of generating reports on-line or in the background. When a report is scheduled for background generation, administrators can proceed with their other monitoring, diagnosis, and reporting tasks, while the eG manager is processing the report. This saves the administrator valuable time. To schedule background processing of a report, you can either select the Background Save - PDF or the Background Save - CSV option from the Report Generation list. In this case, a Report Name text box will appear, where you would have to provide the name with which the report is to be saved in the background. To process reports in the foreground, select the Foreground Generation - HTML option from this list.
Note:
- The default selection in the Report Generation list will change according to the Timeline specified for the report. If the Timeline set is greater than or equal to the number of days specified against the MinDurationForReport parameter in the [BACKGROUND_PROCESS] section of the eg_report.ini file, then the default selection in the Report Generation list will be Background Save - PDF. On the other hand, if the Timeline set for the report is lesser than the value of the MinDurationForReport parameter, then the default selection in the Report Generation list will be Foreground. This is because, the MinDurationForReport setting governs when reports are to be processed in the background. By default, this parameter is set to 2 weeks - this indicates that by default, reports with a timeline of 2 weeks and above will be processed in the background.
- The Report Generation list will appear only if the EnableBackgroundReport flag in the [BACKGROUND_PROCESS] section of the eg_report.ini file (in the [EG_INSTALL_DIR]\manager\config directory) is set to Yes.
- Click the Done button if any changes were made to the More Options drop down window.
-
Finally, click the Run Report button to generate the report.
-
If the option chosen from the Report Generation list is Foreground Generation - HTML, then clicking the Run Report button will reveal Figure 3.

Figure 3 : The generated Top IGEL Endpoints report
From Figure 3, administrators can figure out the following:
- For each host/component, the Top 10 IGEL Endpoints that were restarted;
- The total memory allocated to the Top 10 IGEL Endpoints associated with each host/component;
- The memory utilized by the Top 10 IGEL Endpoints associated with each host/component and;
- The disk read and disk write time of the Top 10 IGEL Endpoints associated with each host/component.
Using this report, administrators can pinpoint those IGEL Endpoints that are consuming maximum amount of memory resources and those that are taking too long for disk reads/writes. This graph will also help administrators understand if the IGEL Endpoints associated with the host/component has restarted frequently.
-
If the option chosen from the Show By list of Figure 2 is IGEL Endpoints and the option chosen from the Report Generation list is Foreground Generation - HTML, then clicking the Run Report button will reveal Figure 4.

Figure 4 : The generated report when IGEL Endpoints option is chosen from Show By list
Using the generated report, administrators can figure out the Top 10 IGEL Endpoints that are managed in the target environment in terms of memory resource consumption, disk reads/disk writes and frequent restarts.