VMware App Volumes - AppStack Details Report
Administrators can use this report to analyze the trend/behavior noticed in the access of AppStacks, determine which users are accessing the AppStacks and which applications are attached to the AppStacks. This report helps administrators in understanding the applications that are frequently used by the users by accessing the AppStacks. Additionally, this report is more useful to figure out the users who are accessing the AppStacks and helps in determining which users will be impacted the most if the frequently accessed AppStacks encountered problems.
To generate this report, do the following:
- Follow the menu sequence: REPORTS BY FUNCTION -> Domain-specific Reports -> Virtual Applications / Desktops (
-
Figure 1 then appears. In Figure 1, select a criteria for analysis from the Analyze By list box.
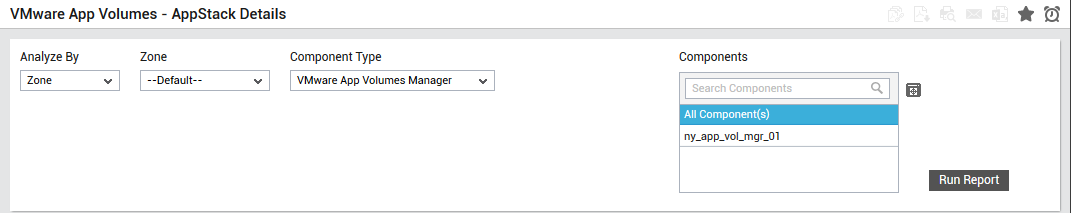
Figure 1 : Specifying the criteria for the AppStack Details report
-
Using this report, you can figure out the details of AppStacks attached to one/more managed VMware App Volumes Manager components, or those that are part of a zone, service or segment. The options provided by the Analyze By list box are discussed hereunder:
- Component: Select this option to choose the component(s) from across all the managed components in the environment.
- Zone: To generate a report for one/more components that are included in a zone, pick the Zone option. A Zone drop-down list will then appear, from which you would have to select the zone to which the components of interest to you belong. A Sub zone flag also appears. Indicate whether the components present within the sub-zones of the chosen zone are also to be to be considered for report generation, by setting the Sub zone flag to Yes.
- Segment: If you want to generate a report for one/more chosen components that belong to a segment, select the Segment option from Analyze By list box, and then pick the Segment from the drop-down list that appears.
- Service: If you want to generate a report for one/more components involved in the delivery of a service, select the Service option from Analyze By, and then pick the required Service from the drop-down list that appears.
- By default, VMware App Volumes Manager component will be chosen from the Component Type list.
- The Component list will now be populated with all the components that are managed in your environment for the chosen component type. If the Components list consists of too many components, then viewing all the components and selecting the ones you need for report generation could require endless scrolling. To avoid this, you can click the
 button next to the Components list. A Components pop up window will then appear using which you can view almost all the components in a single interface and Select the ones to be included in this report.
 - Finally, click the Run Report button to generate the report.
-
Figure 2 will then appear.
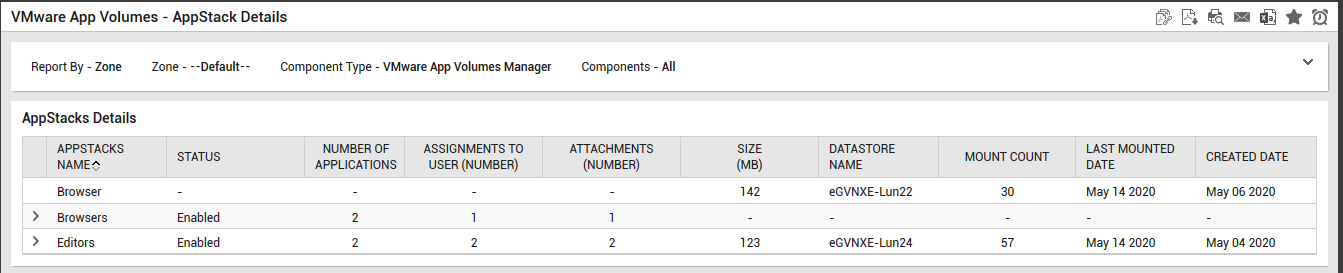
Figure 2 : The generated AppStack Details Report
Using the generated report, administrators can analyze the trend/behavior noticed in the access of AppStacks, determine how many users are accessing the AppStacks, the date on which the AppStacks were created and the date on which the AppStack was mounted for access by a user. Further drilling down each AppStack will reveal Figure 3.
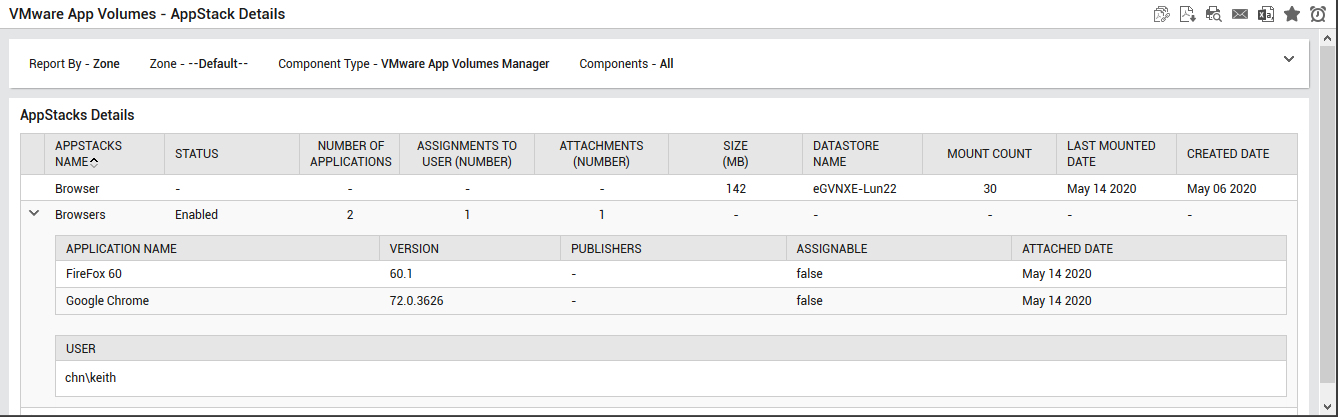
Figure 3 : Identifying the users accessing the AppStacks
From Figure 3, administrators can identify the applications that are attached to the chosen AppStack. This report is more useful to figure out the users who are accessing the AppStacks and helps in determining which users will be impacted the most if the frequently accessed AppStacks encountered problems.