Virtual Machines - Resource Analytics Report
The Virtual Machines - Resource Analytics report enables administrators to zoom into a particular VM, analyze its performance up, close, and accurately determine the following:
- Has the VM been frequently moved to other hosts?
- Which are the servers to which a VM has been Vmotioned during a given period?
- Why was the VM moved? Is it because the VM is resource-intensive and is hence eroding the physical resources of the host, or is it owing to the fact that the host is not adequately sized to support the VM’s operations?
- How well is the VM using the resources allocated to it? Are spikes in usage sporadic/consistent? Have these usage patterns impacted the performance of any of the hosts on which the VM was Vmotioned/XenMotioned to during the designated period? What could be the reason for this anomaly - a resource-hungry application executing on the VM or insufficient resource allocation to the VM by the host?
To facilitate this analysis, the Virtual Machines - Resource Analytics category of reports helps generate two types of reports - namely, the Physical Resources Usage report, and the Virtual Resources Usage report.
Physical Resources Usage Report
Using the Physical Resources Usage report, administrators can track the movement of a VM across physical servers, compare the relative resource usage of that VM across these physical servers, and determine why the move happened in the first place - is the VM so resource-hungry that it drains the physical server of its resources, or are one/more hosts starved for resources?
To generate the Physical Resources Usage report, do the following:
- Follow the menu sequence: REPORTS BY FUNCTION -> Domain-specific Reports -> Virtualization -> Virtual Machines -> VM Details in the eG Reporter interface.
-
From the Selection list in Figure 1, pick the Physical Resources Usage option.

Figure 1 : Specifying the criteria for generating the PHYSICAL RESOURCES USAGE report
- Next, select Graph from the Report Type field to generate a graphical report. For a data report, select the Data option.
- Pick the virtual component type for which the report is to be generated from the Component Type list.
-
All the guests executing on all managed components of the chosen Component Type will then be available in the Virtual Machine list. By default, if eG Enterprise discovers over 100 VMs on physical servers of the chosen type, then a Filter by field will appear in Figure 1 (not shown in Figure 1) to enable you to trim down the Virtual Machine list and quickly locate the VM that interests you. To filter the VM list, just enter the whole/part of the VM name that you are looking for in the Filter by text box and click the right-arrow button next to it. Only those VMs with names that embed the specified string will then be listed in the Virtual Machine list. Pick a VM from this list to focus on its performance.
Note:
As stated earlier, by default, the Filter by text box appears if the number of VMs is equal to or over 100. To override this default setting, do the following:
- Edit the eg_report.ini file in the <EG_INSTALL_DIR>\manager\config directory.
- In the [MEASURE_GROUP] section of the file, set the MoreVMs to a different value. The default is 100.
- Save the file.
- If you want to analyze the performance of the chosen VM only on those ESX servers that are managed by a particular vCenter server, pick this server from the vCenter list. Upon selecting a vCenter, the ESX servers managed by that vCenter server will be available for selection in the Physical Servers list.
- Selecting All from the vCenter list on the other hand allows you to compare the performance of the VM across all ESX servers, regardless of whether/not they are managed by vCenter. In this case therefore, all eG-managed ESX servers will be available for selection in the Physical Servers list.
- Pick one/more of the physical servers listed in the Physical Servers list for report generation. If this list consists of too many physical servers, then viewing all the components and selecting the ones you need for report generation could require endless scrolling. To avoid this, you can click the
 button next to the Physical Servers list. The PHYSICAL SERVERS pop up window will then appear using which you can view almost all the physical severs in a single interface and select the ones for which the report is to be generated.
 -
Then, specify the Timeline for the graph. You can either provide a fixed time line such as 1 hour, 2 days, etc., or select the Any option from the list to provide a From and To date/time for report generation.
Note:
For every user registered with the eG Enterprise system, the administrator can indicate the maximum timeline for which that user can generate a report. Once the maximum timeline is set for a user, then, whenever that user logs into eG Reporter and attempts to generate a report, the Timeline list box in the report page will display options according to the maximum timeline setting of that user. For instance, if a user can generate a report for a maximum period of 3 days only, then 3 days will be the highest option displayed in the Timeline list - i.e., 3 days will be the last option in the fixed Timeline list. Similarly, if the user chooses the Any option from the Timeline list and proceeds to provide a start date and end date for report generation using the From and To specifications, eG Enterprise will first check if the user's Timeline specification conforms to his/her maximum timeline setting. If not, report generation will fail. For instance, for a user who is allowed to generate reports spanning over a maximum period of 3 days only, the difference between the From and To dates should never be over 3 days. If it is, then, upon clicking the Run Report button a message box will appear, prompting the user to change the From and To specification.
-
In addition to the settings discussed above, this report comes with a set of default specifications. These settings are hidden by default. If you do not want to disturb these default settings, then you can proceed to generate the report by clicking the Run Report button soon after you pick one/more Physical Servers. However, if you want to view and then alter these settings (if required), click on the
 button. The default settings will then appear in the MORE OPTIONS drop down window (see Figure 2). The steps below discuss each of these settings and how they can be customized.
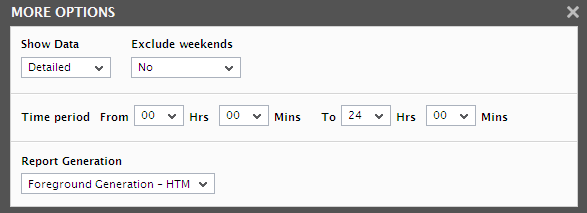
Figure 2 : The default settings for generating a Physical Resources Usage report
-
eG Enterprise collects a wide range of physical resource usage metrics - i.e., ‘outside view’ metrics - from a VM. Using the Physical Resources Usage report, you can focus on how a chosen VM utilizes a specific resource - say CPU, memory, disk space, etc. For this purpose, by default, eG Enterprise groups the physical resource usage-metrics of a VM into four different ‘resource groups’, based on the ‘resource type’. These groups are, namely: Memory usage, CPU usage, Disk usage, and Network usage. For instance, all key metrics related to memory usage - eg., allocated memory size, Memory max limited, Target memory, etc. - are by default included in the Memory usage group. Also, to provide administrators with a clearer view of a VM’s resource usage, eG Enterprise, by default, computes the Avg and Max values of every metric in a group, and displays one/all of the computed values in the report. To know how the chosen VM has used a particular resource across the selected Components, pick one of the above-mentioned resource groups from the Measure Group list. On the other hand, if you want to generate a report that brings out the overall resource usage of a VM across the chosen Components, then select All from the Measure Group list.
Note:
The default resource groups - Memory usage, CPU usage, Disk usage, and Network usage- are hard-coded in the eG Enterprise system. The names of these groups cannot be changed, and no new resource groups can be introduced. However, if need be, additional metrics can be included in the default groups, and additional functions can be applied to any of the grouped metrics. For instance to add the CPU guaranteed to VMmetric to the CPU usagegroup, do the following:
- Edit the eg_report.ini file in the <EG_INSTALL_DIR>\manager\config directory.
-
In the [measure_group] section of the file, insert a line for the new metric, in the following format:
Cpu_usage:<InternalTestName>:<InternalMeasureName>=<Comma-separated list of functions>
For the CPU guaranteed to VM measure therefore, your specification should be:
Cpu_usage:EsxGuestTest:Cpu_guaranteed=Avg,Max
To know the <InternalTestName>and <InternalMeasureName>, refer to the procedure discussed in Page First, determine the Internal name of the test and measure to be configured. For that, do the following: of this document.
- Finally, save the file.
Similarly, new metrics/functions can be added to the Memory_usage, Disk_usage, and Network_usagegroups.
-
The speed with which a report is generated depends primarily on the report Timeline. While a Timeline that varies between a couple of days to a week enables the eG Enterprise system to quickly retrieve the required data, timelines that span multiple weeks/months could slow-down the data retrieval and report generation process to a considerable extent, owing to the volume of data involved. In order to ensure quick and easy access to reports, eG Enterprise provides you the option of enabling data retrieval from the Trend information in the database, instead of the Detailed test information that is used by default for report generation. The Detailed test information based comprises of multiple measurement records for a test - one or more each for every test execution. Whereas, the Trend information includes only hourly, daily, and monthly summary computations for a test performed on a continuous basis. For instance, during a period of 1 hour, a test that runs every 5 minutes inserts atleast 12 records into the Detailed test information base. On the other hand, the Trend information base would consist of only 1 record for the same 1 hour period. Fewer the number of records, query execution becomes much quicker, and data retrieval faster. To use the trend data for report generation, you will have to select the Trend option from the Show Data field in Figure 2. By default, the Detailed option is selected in Figure 2 indicating that the report data is retrieved from the detailed test information in the database. If need be, you can also ensure that all reports always use the Detailed test tables alone by hiding the Show Data field from the reporter interface. To achieve this, do the following:
- Login to the eG administrative interface as 'admin'.
- Select the Manager option from the Settings tile that appears when the
 button against the Admin tab is clicked.
 -
From the GENERAL SETTINGS page that then appears, if you set the Compute average/sum of metrics while trending flag to No, then the Show Data field will not appear in the reporter interface; this denies users access to the Trend option, and thus ensures that reports are always generated using the Detailed tables.
Note:
- A Trend report will not include the data for the current day since trend data is only computed at the end of the day.
- If the Trend option is chosen, the time period of the report should be greater than 1 day.
-
The usage of Detailed test tables for generating reports, especially those that span weeks, increases the stress on the eG database, thus resulting in undue delays in report generation. In order to ensure that the database is not choked by such voluminous data requests, you can configure eG Enterprise to automatically "force" the use of the Trend option if the Timeline of a report exceeds a pre-configured duration. To specify this time boundary, do the following:
- Edit the eg_report.ini file in the <EG_INSTALL_DIR>\manager\config directory.
- In the [MISC] section of the file, you will find a DetailedTime parameter.
- Specify the duration (in days) beyond which Detailed reports cannot be generated, against the DetailedTime parameter, and save the eg_report.ini file.
- For instance, to make sure that Detailed reports are disallowed for a Timeline of over 2 weeks, set the DetailedTime parameter to 14 and save the file.
- Say, subsequently, you attempt to generate a Detailed report for a FixedTimeline of 3 weeks (which is greater than the 14-day limit set in our example). The instant you select the 3 weeks option from the Fixed list box, the Detailed option gets automatically disabled, and the Trend option gets enabled. Similarly, if you specify an AnyTimeline that runs over 14 days, then, upon clicking the Run Report button to generate the report, a message box appears (see Figure 8) informing you that only the Trend option is permitted.
- To proceed with the Trend report generation, click the ok button in the message box. To terminate Trend report generation, click the Cancel button.
-
If the timeline specified for the report needs to exclude the data collected during the Weekends, then set Exclude weekends to Yes. If not, select No.
Note:
By default, the weekend constitutes Saturday and Sunday. To override this default setting, do the following:
- Edit the eg_report.ini file in the <EG_INSTALL_DIR>\manager\config directory.
- In the [measure_group] section of the file, the exclude_weekendparameter is set to Saturday,Sunday by default. You can modify this by setting the exclude_weekend parameter to a comma-separated list of other days of the week - say Friday,Saturday.
- Save the file after making the required changes.
- Next, indicate the report Time period.
-
In large environments, reports generated using months of data can take a long time to complete. Administrators now have the option of generating reports on-line or in the background. When a report is scheduled for background generation, administrators can proceed with their other monitoring, diagnosis, and reporting tasks, while the eG manager is processing the report. This saves the administrator valuable time. To schedule background processing of a report, you can either select the Background Save - PDF option or the Background Save - CSV option from the Report Generation list. In this case, a Report Name text box will appear, where you would have to provide the name with which the report is to be saved in the background. To process reports in the foreground, select the Foreground Generation - HTML option from this list.
Note:
- The Report Generation list will appear only if the EnableBackgroundReport flag in the [BACKGROUND_PROCESS] section of the eg_report.ini file (in the [EG_INSTALL_DIR]\manager\config directory) is set to Yes.
- The default selection in the Report Generation list will change according to the Timeline specified for the report. If the Timeline set is greater than or equal to the number of days specified against the MinDurationForReport parameter in the [BACKGROUND_PROCESS] section of the eg_report.ini file, then the default selection in the Report Generation list will be Background Save - PDF. On the other hand, if the Timeline set for the report is lesser than the value of the MinDurationForReport parameter, then the default selection in the Report Generation list will be Foreground. This is because, the MinDurationForReport setting governs when reports are to be processed in the background. By default, this parameter is set to 2 weeks - this indicates that by default, reports with a timeline of 2 weeks and above will be processed in the background.
- Finally, click the Run Report button.
-
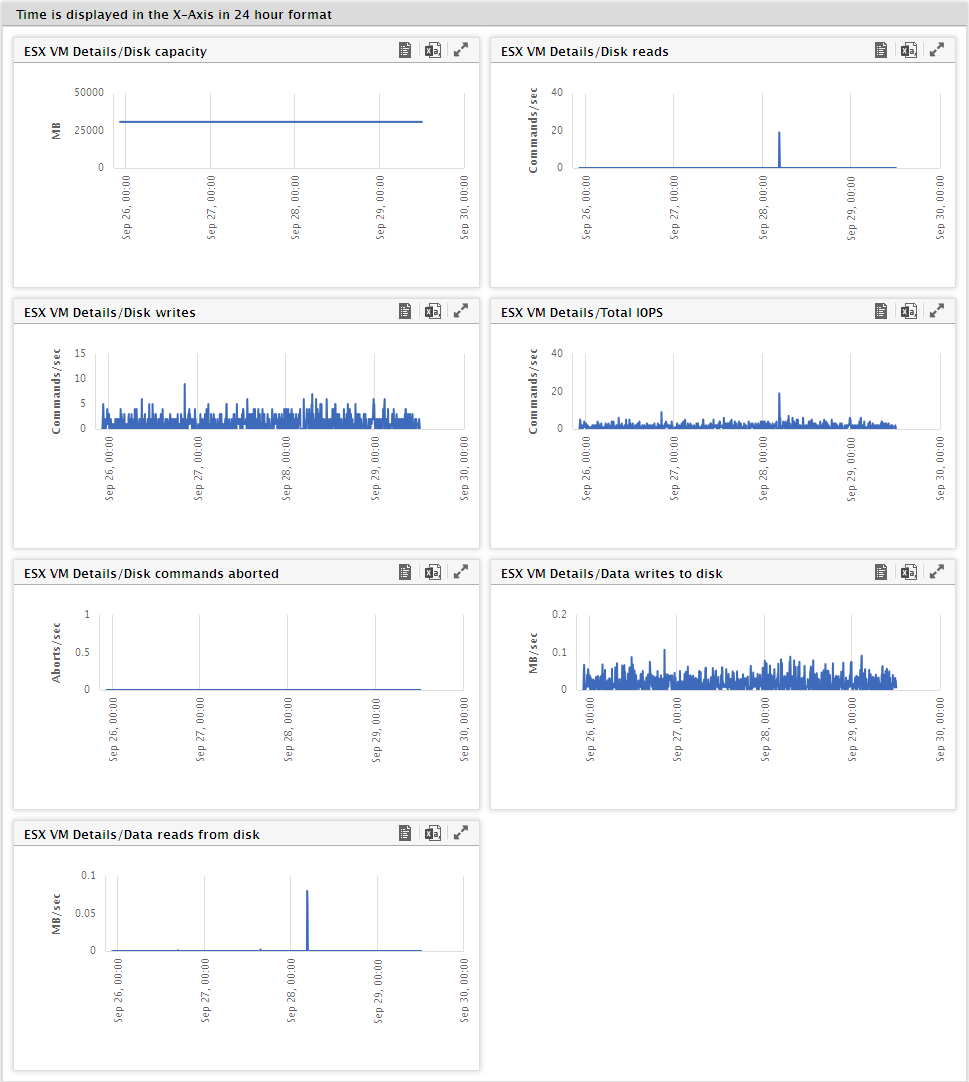
If the Report Type is Graph and the option chosen from the Report Generation list is Foreground Generation - HTML, then, clicking on the Run Report button will invoke Figure 3. The Graph report applies the first of the configured functions (i.e., Avg by default) on every metric in the chosen group, and generates time-of-day graphs revealing the variations in the computed values across the chosen Components during the specified period. These graphs help determine whether/not the chosen VM has made optimal use of the critical resource on every physical server that it has been moved to during the stated period, and enables you to understand whether excessive usage of the chosen resource by the VM is the reason for its movement.
-
If the Report Type were Data, then you would not be required to choose a Measure Group. The Data report applies all the configured functions (i.e., both Avg and Max by default) on every metric in every measure group for each Component chosen, and displays all the computed values in a tabular format, once the Run Report button is clicked (see Figure 4). Under the individual measure groups, a component-wide Summary of each metric will be available, followed by the details of the resource usage of every component. In addition, the Data report also reveals how much time the VM spent on each of the chosen Components; this way, any change in the performance of the physical server during that time can be attributed to the presence of the VM. To focus on the performance of all the VMs on a particular virtual component, click on any of the component links in the data report. Figure 5 then appears indicating how every VM executing on that component has performed during the given period.
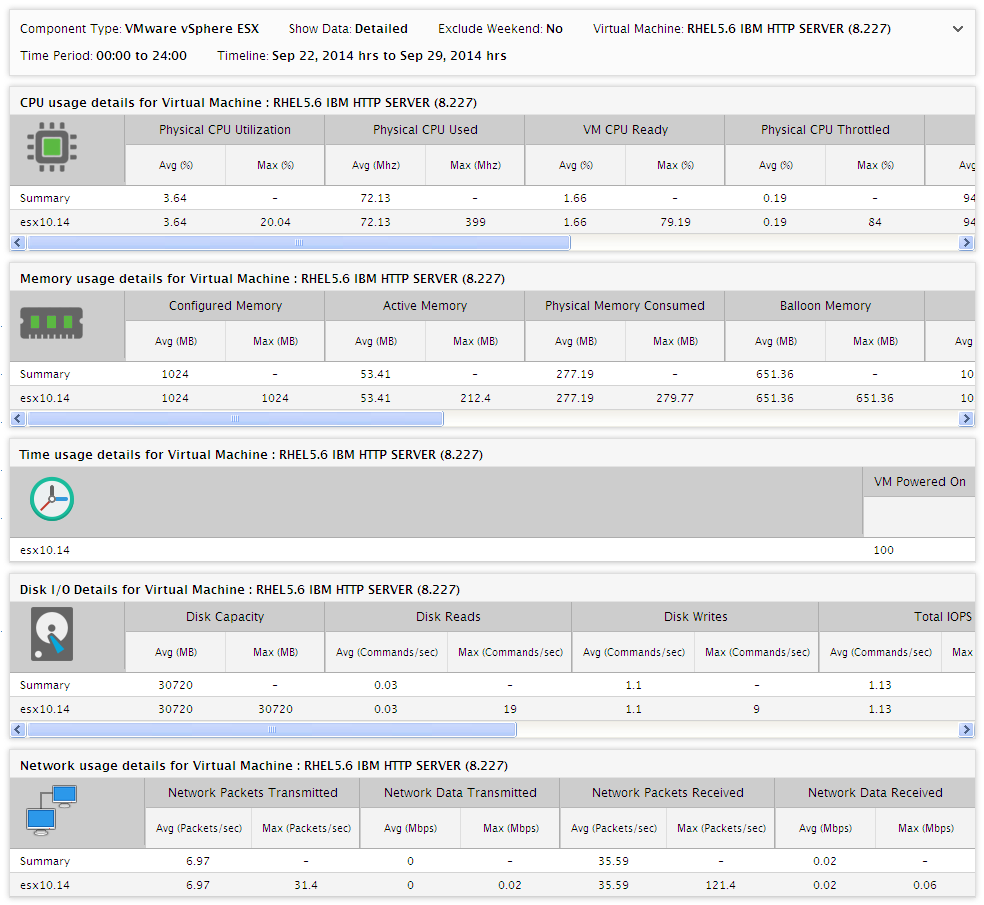
Figure 4 : A Physical Resources Usage report of type Data
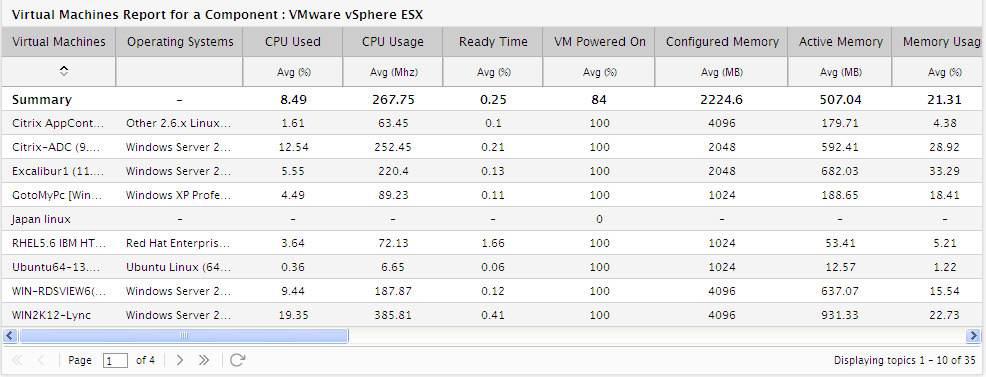
Figure 5 : A Virtual Machines report revealing the health of each VM discovered on a chosen virtual host
- The Data report explores the overall resource usage of a VM across all the physical servers that it has visited during the given period. Using this report, you can accurately identify which resources have been over-utilized by the VM and on which physical server.
Virtual Resources Usage Report
The Virtual Resources Usage report turns an administrator’s attention to resource-intensive VMs and improper resource allocations to a VM.
To generate this report, do the following:
- Follow the menu sequence: REPORTS BY FUNCTION -> Domain-specific Reports -> Virtualization -> Virtual Machines -> Resource Analytics in the eG Reporter interface.
-
From the Selection list in Figure 6, pick the Virtual Resources Usage option.
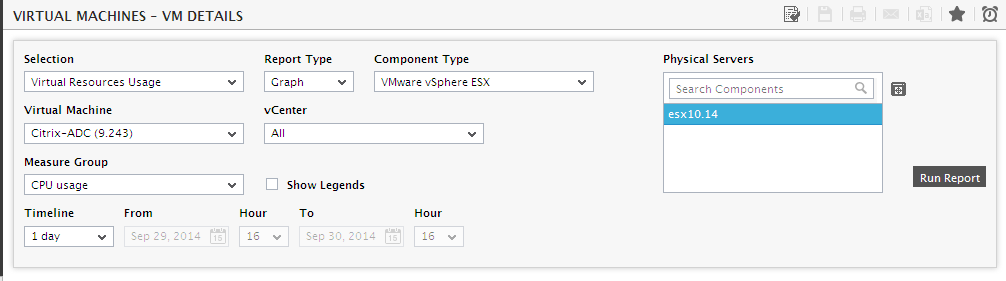
Figure 6 : Specifying the criteria for generating the Virtual Resources Usage report
- Next, select Graph from the Report Type field to generate a graphical report. For a data report, select the Data option.
- Pick the virtual component type for which the report is to be generated from the Component Type list.
-
All the guests executing on all managed components of the chosen Component Type will then be available in the Virtual Machine list. By default, if eG Enterprise discovers over 100 VMs on physical servers of the chosen type, then a Filter by field will appear in Figure 6 (not shown in Figure 6) to enable you to trim down the Virtual Machine list and quickly locate the VM that interests you. To filter the VM list, just enter the whole/part of the VM name that you are looking for in the Filter by text box and click the right-arrow button next to it. Only those VMs with names that embed the specified string will then be listed in the Virtual Machine list. Pick a VM from this list to focus on its performance.
Note:
As stated earlier, by default, the Filter by text box appears if the number of VMs is equal to or over 100. To override this default setting, do the following:
- Edit the eg_report.ini file in the <EG_INSTALL_DIR>\manager\config directory.
- In the [virtual_MEASURE_GROUP] section of the file, set the MoreVMs to a different value. The default is 100.
- Save the file.
- If you want to analyze the performance of the chosen VM only on those ESX servers that are managed by a particular vCenter server, pick this server from the vCenter list. Upon selecting a vCenter, the ESX servers managed by that vCenter server will be available for selection in the Physical Servers list.
- Selecting All from the vCenter list on the other hand allows you to compare the performance of the VM across all ESX servers, regardless of whether/not they are managed by vCenter. In this case therefore, all eG-managed ESX servers will be available for selection in the Physical Servers list.
- Pick one/more of the physical servers listed in the Physical Servers list for report generation. If this list consists of too many physical servers, then viewing all the servers and selecting the ones you need for report generation could require endless scrolling. To avoid this, you can click the button next to the Physical Servers list. This will expand the Physical Servers list so that you can view almost all the components in a single interface and select the ones for which the report is to be generated.
-
eG Enterprise collects a wide range of virtual resource usage metrics - i.e., ‘inside view’ metrics - from a VM. Using the Virtual Resources Usage report, you can focus on how a chosen VM utilizes a specific resource - say CPU, memory, disk space, etc. For this purpose, by default, eG Enterprise groups the virtual resource usage metrics of a VM into six different ‘resource groups’, based on the ‘resource type’. These groups are, namely: Memory usage, CPU usage , Disk usage, Network usage, Tcp Connection, and Uptime Status. For instance, all key metrics related to memory usage – e.g., allocated memory size, Memory max limited, Target memory, etc. - are by default included in the Memory usage group. Also, to provide administrators with a clearer view of a VM’s resource usage, eG Enterprise, by default, computes the Avg and Max values of every metric in a group, and displays these values in the report. To know how the chosen VM has used a particular resource across the selected Components, pick one of the above-mentioned resource groups from the Measure Group list. On the other hand, if you want to generate a report that brings out the overall resource usage of a VM across the chosen Components, then select All from the Measure Group list.
Note:
The default resource groups Memory usage, CPU usage, Disk usage, Network usage, Tcp Connection, and Uptime Status- are hard-coded in the eG Enterprise system. The names of these groups cannot be changed, and no new resource groups can be introduced. However, if need be, additional metrics can be included in the default groups, and additional functions can be applied to any of grouped metrics. For instance to add the Run queue in VMmetric to the CPU usagegroup, do the following:
- Edit the eg_report.ini file in the <EG_INSTALL_DIR>\manager\config directory.
-
In the [virtual_measure_group] section of the file, insert a line for the new metric, in the following format:
Cpu_usage:<InternalTestName>:<InternalMeasureName>=<Comma-separated list of functions>
For the Run queue in VMmeasure therefore, your specification should be:
Cpu_usage:VmgSystemTest:Run_queue_length=Avg,Max
To know the <InternalTestName>and <InternalMeasureName>, refer to the procedure discussed in Page First, determine the Internal name of the test and measure to be configured. For that, do the following: of this document.
- Finally, save the file.
Similarly, new metrics/functions can be added to the Memory_usage, Disk_usage, Network_usage, Tcp Connection, and Uptime Statusgroups.
-
Then, specify the Timeline for the graph. You can either provide a fixed time line such as 1 hour, 2 days, etc., or select the Any option from the list to provide a From and To date/time for report generation.
Note:
For every user registered with the eG Enterprise system, the administrator can indicate the maximum timeline for which that user can generate a report. Once the maximum timeline is set for a user, then, whenever that user logs into eG Reporter and attempts to generate a report, the Timeline list box in the report page will display options according to the maximum timeline setting of that user. For instance, if a user can generate a report for a maximum period of 3 days only, then 3 days will be the highest option displayed in the Timeline list - i.e., 3 days will be the last option in the fixed Timeline list. Similarly, if the user chooses the Any option from the Timeline list and proceeds to provide a start date and end date for report generation using the From and To specifications, eG Enterprise will first check if the user's Timeline specification conforms to his/her maximum timeline setting. If not, report generation will fail. For instance, for a user who is allowed to generate reports spanning over a maximum period of 3 days only, the difference between the From and To dates should never be over 3 days. If it is, then, upon clicking the Run Report button a message box will appear, prompting the user to change the From and To specification.
-
In addition to the settings discussed above, this report comes with a set of default specifications. These settings are hidden by default. If you do not want to disturb these default settings, then you can proceed to generate the report by clicking the Run Report button soon after you pick one/more Physical Servers. However, if you want to view and then alter these settings (if required), click on the
button. The default settings will then appear in the MORE OPTIONS drop down window (see Figure 7). The steps below discuss each of these settings and how they can be customized.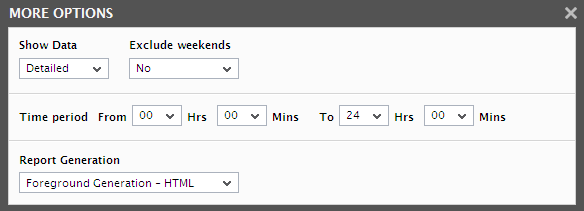
Figure 7 : The default settings for generating the Virtual Resources Usage report
-
The speed with which a report is generated depends primarily on the report Timeline. While a Timeline that varies between a couple of days to a week enables the eG Enterprise system to quickly retrieve the required data, timelines that span multiple weeks/months could slow-down the data retrieval and report generation process to a considerable extent, owing to the volume of data involved. In order to ensure quick and easy access to reports, eG Enterprise provides you the option of enabling data retrieval from the Trend information in the database, instead of the Detailed test information that is used by default for report generation. The Detailed test information based comprises of multiple measurement records for a test - one or more each for every test execution. Whereas, the Trend information includes only hourly, daily, and monthly summary computations for a test performed on a continuous basis. For instance, during a period of 1 hour, a test that runs every 5 minutes inserts atleast 12 records into the Detailed test information base. On the other hand, the Trend information base would consist of only 1 record for the same 1 hour period. Fewer the number of records, query execution becomes much quicker, and data retrieval faster. To use the trend data for report generation, you will have to select the Trend option from the Show Data field in Figure 7. By default, the Detailed option is selected in Figure 7 indicating that the report data is retrieved from the detailed test information in the database. If need be, you can also ensure that all reports always use the Detailed test tables alone by hiding the Show Data field from the reporter interface. To achieve this, do the following:
- Login to the eG administrative interface as 'admin'.
- Select the Manager option from the Settings tile that appears when the button against the Admin tab is clicked.
-
From the GENERAL SETTINGS page that then appears, if you set the Compute average/sum of metrics while trending flag to No, then the Show Data field will not appear in the reporter interface; this denies users access to the Trend option, and thus ensures that reports are always generated using the Detailed tables.
Note:
- A Trend report will not include the data for the current day since trend data is only computed at the end of the day.
- If the Trend option is chosen, the time period of the report should be greater than 1 day.
-
The usage of Detailed test tables for generating reports, especially those that span weeks, increases the stress on the eG database, thus resulting in undue delays in report generation. In order to ensure that the database is not choked by such voluminous data requests, you can configure eG Enterprise to automatically "force" the use of the Trend option if the Timeline of a report exceeds a pre-configured duration. To specify this time boundary, do the following:
- Edit the eg_report.ini file in the <EG_INSTALL_DIR>\manager\config directory.
- In the [MISC] section of the file, you will find a DetailedTime parameter.
- Specify the duration (in days) beyond which Detailed reports cannot be generated, against the DetailedTime parameter, and save the eg_report.ini file.
- For instance, to make sure that Detailed reports are disallowed for a Timeline of over 2 weeks, set the DetailedTime parameter to 14 and save the file.
- Say, subsequently, you attempt to generate a Detailed report for a FixedTimeline of 3 weeks (which is greater than the 14-day limit set in our example). The instant you select the 3 weeks option from the Fixed list box, the Detailed option gets automatically disabled, and the Trend option gets enabled. Similarly, if you specify an AnyTimeline that runs over 14 days, then, upon clicking the Run Report button to generate the report, a message box appears (see Figure 8) informing you that only the Trend option is permitted.
- To proceed with the Trend report generation, click the ok button in the message box. To terminate Trend report generation, click the Cancel button.
-
If the timeline specified for the report needs to exclude the data collected during the Weekends, then set Exclude weekends to Yes. If not, select No.
Note:
By default, the weekend constitutes Saturday and Sunday. To override this default setting, do the following:
- Edit the eg_report.ini file in the <EG_INSTALL_DIR>\manager\config directory.
- In the [virtual_measure_group] section of the file, the exclude_weekend parameter is set to Saturday,Sunday by default. You can modify this by setting the exclude_weekend parameter to a comma-separated list of other days of the week - say Friday,Saturday.
- Save the file after making the required changes.
- Next, indicate the report Time period.
-
In large environments, reports generated using months of data can take a long time to complete. Administrators now have the option of generating reports on-line or in the background. When a report is scheduled for background generation, administrators can proceed with their other monitoring, diagnosis, and reporting tasks, while the eG manager is processing the report. This saves the administrator valuable time. To schedule background processing of a report, select the Background Save - PDF option from the Report Generation list. In this case, a Report Name text box will appear, where you would have to provide the name with which the report is to be saved in the background. To process reports in the foreground, select the Foreground Generation - HTML option from this list.
Note:
- The Report Generation list will appear only if the EnableBackgroundReport flag in the [BACKGROUND_PROCESS] section of the eg_report.ini file (in the [EG_INSTALL_DIR]\manager\config directory) is set to Yes.
- The default selection in the Report Generation list will change according to the Timeline specified for the report. If the Timeline set is greater than or equal to the number of days specified against the MinDurationForReport parameter in the [BACKGROUND_PROCESS] section of the eg_report.ini file, then the default selection in the Report Generation list will be Background. On the other hand, if the Timeline set for the report is lesser than the value of the MinDurationForReport parameter, then the default selection in the Report Generation list will be Foreground. This is because, the MinDurationForReport setting governs when reports are to be processed in the background. By default, this parameter is set to 2 weeks - this indicates that by default, reports with a timeline of 2 weeks and above will be processed in the background.
-
Finally, click the Run Report button. If the Report Type is Graph and the option chosen from the Report Generation list is Foreground Generation - HTML, then clicking on the Run Report button invokes Figure 8. The Graph report applies the first of the configured functions (i.e., Avg by default) on every metric in the chosen group, and generates time-of-day graphs revealing the variations in the computed values across the chosen Components during the specified period. These graphs help determine whether applications executing on the VM are consuming the resources allocated to the VM excessively, or whether the VMs are inadequately sized.
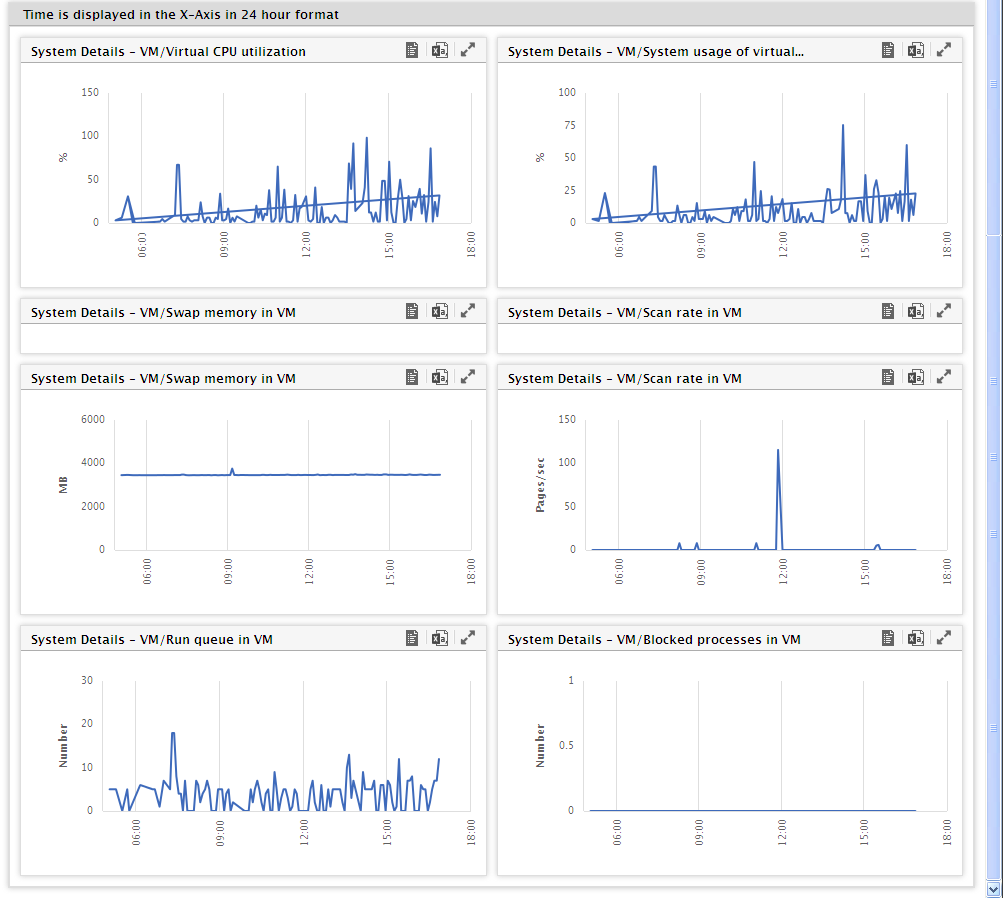
-
If the Report Type were Data, then you would not be required to choose a Measure Group. The Data report applies all the configured functions (i.e., both Avg and Max by default) on every metric in every measure group, and displays all the computed values in a tabular format, once the Run Report button is clicked (see Figure 9). Under the individual measure groups, a component-wide Summary of each metric will be available, followed by the details of the resource usage of every component. To zoom into the overall health of all the VMs executing on a particular Component (i.e., physical server) displayed in the data report, click on the component. Figure 9 appears allowing you a sneak peek at the performance of every VM executing on that virtual host.
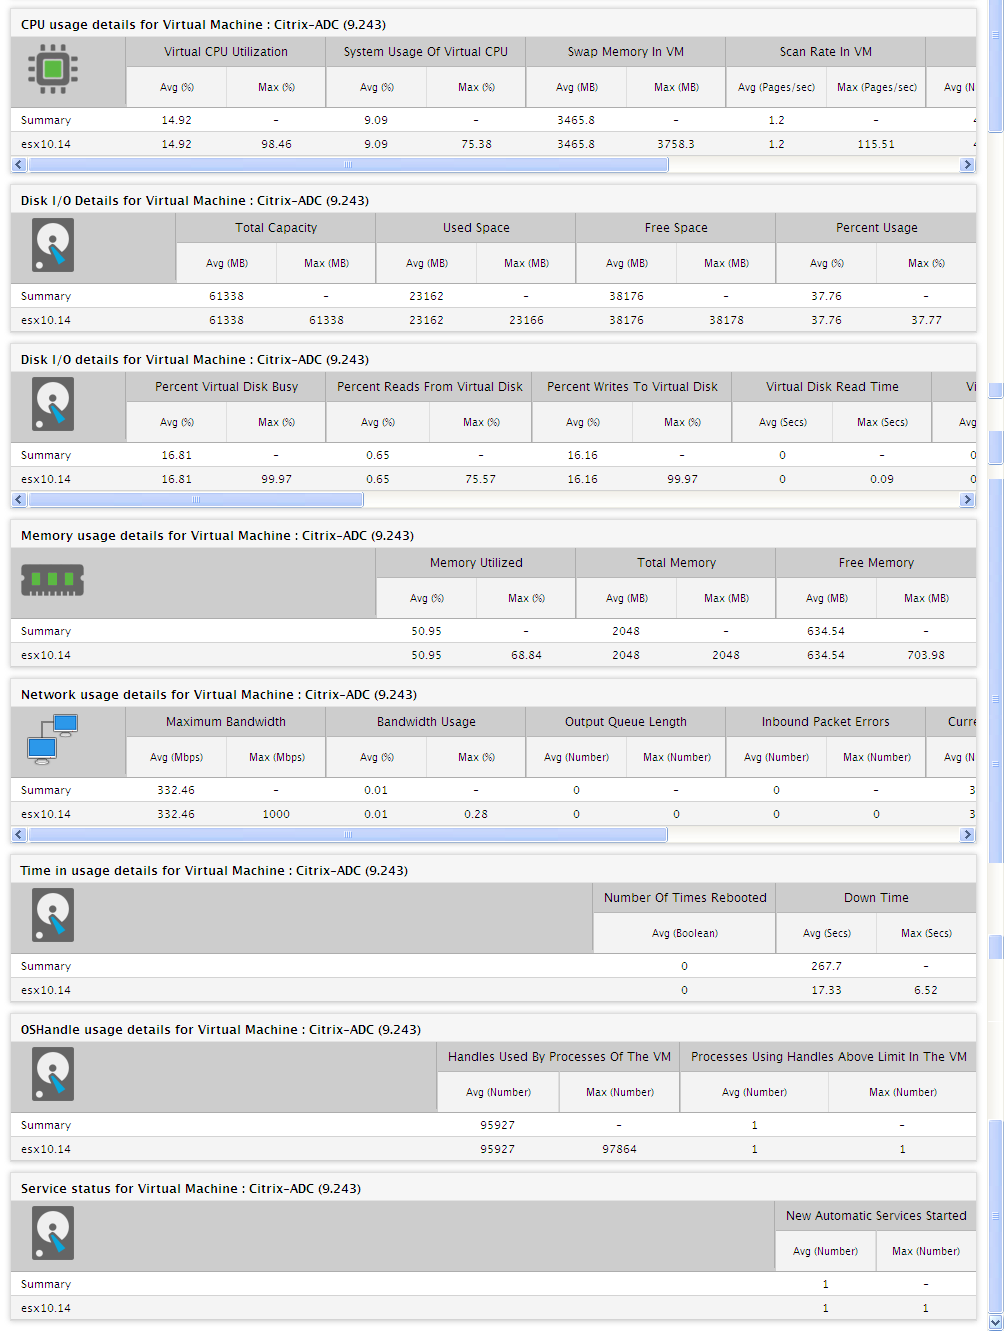
Figure 9 : A Virtual Resources Usage report of type Data
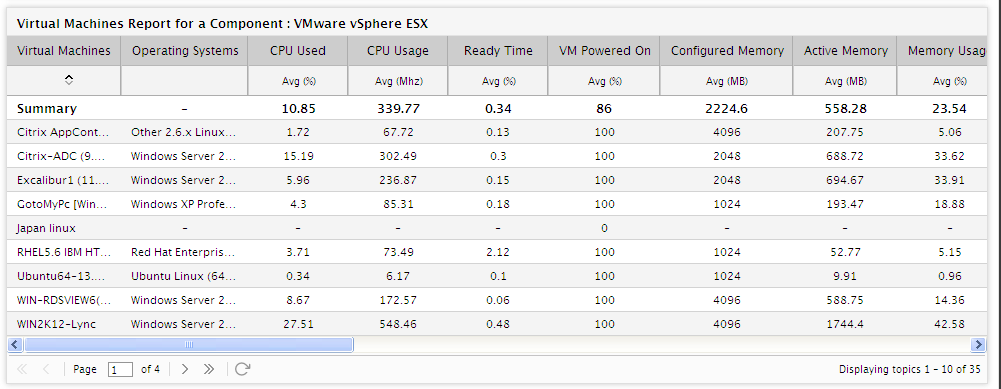
Figure 10 : A Virtual Machines report revealing the health of each VM discovered on a chosen virtual host
- The Data report explores the overall resource usage of a VM across all the physical servers that it has visited during the given period. Using this report, you can accurately identify which virtual resources have been over-utilized by the VM and on which physical server.
- On the other hand, if the Background Save - PDF option is chosen from the Report Generation list, then clicking on the Run Report button will not generate the report and display it in this page for your benefit. Instead, a message indicating that the report is being processed in the background will appear. This will be accompanied by a link that will lead you to the page that lists all the reports that are being processed in the background, and their current status. If background report generation fails for a report, you can regenerate that report using this page, or can even delete that report if need be. On the other hand, if background processing successfully completes for your report, then, you can view a PDF of the report by clicking on the
 icon in that page.