Virtual Machines - Right -Sizing Report
In large virtualized environments where the role of each individual VM plays a major role, it is essential to provision the VMs with appropriate sizing. This way, you can maintain the load on the VM. Using this report, you can - identify the VMs that are highly in need of CPU resources and those that are possessing CPU resources that are utilized in sparse; and helps you in resizing the VMs according to the vCPU utilization.
To generate the Virtual Machines - Right-Sizing report, do the following:
- Follow the menu sequence: REPORTS BY FUNCTION -> Domain-specific Reports -> Virtualization -> Virtual Machines -> Right-Sizing in the eG Reporter interface.
-
Figure 1 will then appear. Pick a criterion for analysis from the Analyze by list. Using this report, you can analyze the size of the VMs available in the servers that are part of a segment, service, or a zone. The options provided by the Analyze by list box are discussed hereunder:
- Component: Select this option to choose the component(s) from across all the managed components in the environment.
- Service: Select this option if the components for which a report is to be generated are involved in the delivery of a business service. Then, select a Service.
- Segment: Choose this option if the components for which this report is to be generated are part of a segment. Then, pick a Segment for analysis.
-
Zone: Pick this option if the components chosen are part of a zone. Then, choose a Zone. Also, indicate whether the components within the sub-zones of the chosen zone are also to be considered for report generation, by selecting an option from the Include Subzone list.
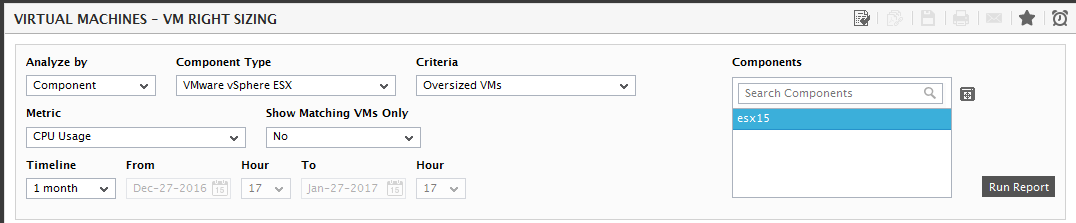
Figure 1 : Selecting the criteria for the Virtual Machines - Right -Sizing report
- Select the Component Type for which you wish to analyze the sizing of the VMs.
- The Components list will then be populated with the servers that match the Analyze By criteria specified earlier. From this list, select the components for which the report is to be generated. If the Components list consists of too many components, then viewing all the components and selecting the ones you need for report generation could require endless scrolling. To avoid this, you can click the
 button next to the Components list. The COMPONENTS pop up window will then appear using which you can view almost all the components in a single interface and select the ones for which the report is to be generated.
 - Pick an option from the Criteria list box using which you could generate a report based on the size (oversize/undersize) of the VMs. By default, the Oversized VMs option is selected from this list. If the Undersized VMs option is chosen from this list, then the report will be generated for all the VMs that are undersized.
- Select a Metric based on which you wish to generate this report. By default, this report is generated based on the CPU Usage measure i.e., you are allowed to generate the report based on the utilization of vCPUs. Similarly, you can generate this report to figure out the VMs that should be right sized based on memory utilization and GPU utilization.
- If you wish to view only the oversized/undersized VMs for the chosen server in the target environment, set the Show Matching VMs Only flag to Yes. By default, this flag is set to No.
-
In addition to the settings discussed above, this report comes with a set of default specifications. These settings are hidden by default. If you do not want to disturb these default settings, then you can proceed to generate the report by clicking the Run Report button soon after you pick a Component. However, if you want to view and then alter these settings (if required), click on the
 button. The default settings will then appear in the MORE OPTIONS drop down window (see Figure 2). The steps below discuss each of these settings and how they can be customized.
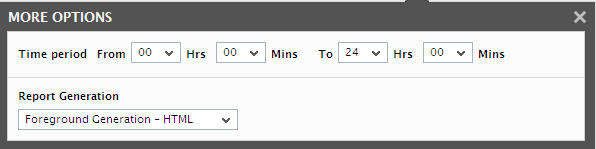
Figure 2 : The default settings for generating the Virtual Machines – Right Sizing report
- Next, indicate the report Timeperiod.
-
Then, specify the Timeline for which the report is to be generated. You can either provide a fixed time line such as 1 hour, 2 days, etc., or select the Any option from the list to provide a From and To date/time for report generation.
Note:
For every user registered with the eG Enterprise system, the administrator can indicate the maximum timeline for which that user can generate a report. Once the maximum timeline is set for a user, then, whenever that user logs into eG Reporter and attempts to generate a report, the Timeline list box in the report page will display options according to the maximum timeline setting of that user. For instance, if a user can generate a report for a maximum period of 3 days only, then 3 days will be the highest option displayed in the Timeline list - i.e., 3 days will be the last option in the fixed Timeline list. Similarly, if the user chooses the Any option from the Timeline list and proceeds to provide a start date and end date for report generation using the From and To specifications, eG Enterprise will first check if the user's Timeline specification conforms to his/her maximum timeline setting. If not, report generation will fail. For instance, for a user who is allowed to generate reports spanning over a maximum period of 3 days only, the difference between the From and To dates should never be over 3 days. If it is, then, upon clicking the Run Report button a message box will appear, prompting the user to change the From and To specification.
-
eG Enterprise allows users to generate desired reports for a specific time period. In large environments, while generating reports for long time periods, say a few weeks to months, report generation was found to slow down, owing to the large volume of data being processed. If users needed to generate many such reports quickly, the slowdown compelled them to generate these reports one after another, thus affecting the speed of their operations, and consequently, their productivity. eG Enterprise now includes a background processing feature that will enable users to process multiple reports, spanning long time periods in the background, while allowing them the bandwidth to generate short-term reports in the foreground. This way, users can generate multiple reports with little-to-no loss of time. To schedule background processing of a report, select the Background Save - PDF option from the Report Generation list. In this case, a Report Name text box will appear, where you would have to provide the name with which the report is to be saved in the background. To process reports in the foreground, select the Foreground Generation - HTML option from this list.
Note:
- The Report Generation list will appear only if the EnableBackgroundReport flag in the [BACKGROUND_PROCESS] section of the eg_report.ini file (in the {EG_INSTALL_DIR}\manager\config directory) is set to Yes.
- The default selection in the Report Generation list will change according to the Timeline specified for the report. If the Timeline set is greater than or equal to the number of days specified against the MinDurationForReport parameter in the [BACKGROUND_PROCESS] section of the eg_report.ini file, then the default selection in the Report Generation list will be Background. On the other hand, if the Timeline set for the report is lesser than the value of the MinDurationForReport parameter, then the default selection in the Report Generation list will be Foreground. This is because, the MinDurationForReport setting governs when reports are to be processed in the background. By default, this parameter is set to 2 weeks - this indicates that by default, reports with a timeline of 2 weeks and above will be processed in the background.
-
Finally, click the Run Report button.
-
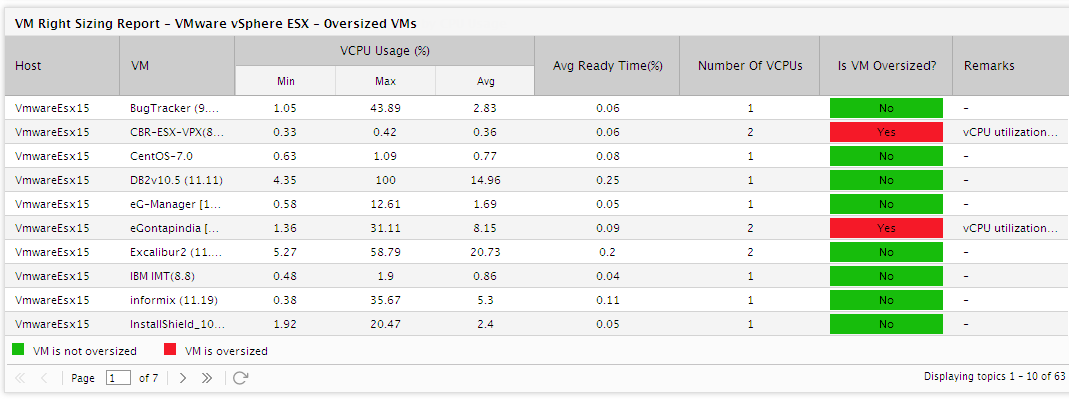
The Virtual Machines - Right Sizing report (see Figure 3) then appears. For each VM hosted for the chosen component, this report lists the percentage of vCPU that is utilized, the number of vCPUs and an indication of whether the VM is oversized/undersized. If a particular VM is oversized, then the value Yes encoded with Red color is specified in the Is VM Oversized? column against that VM. The value No encoded with Green color in this column specifies that the VM is adequately sized. Likewise, if the VM is oversized, then a message will appear in the Remarks column suggesting you to reduce the exact number of vCPUs so that the VM can be optimally sized. The same procedure is followed to indicate the VMs that are undersized. In this case, the Is VM Undersized? column is used to indicate the VMs that are undersized. Based on the Number of vCPUs and the vCPU Usage (see Figure 3) of the individual VM, you can conclude whether the VM is adequately sized or is currently oversized/undersized. Let us take the example of the VM CBR-ESX-VPX from Figure 3 which is currently indicated as oversized in this report. The Maximum vCPU Usage of this VM is just 0.42% and the number of vCPUs allocated to this VM is 2. This indicates that the VM is utilized sparsely and the vCPU resources allocated for this VM is more than enough and is not completely utilized. Therefore we can consider reducing the number of vCPUs for this VM so that the VM can be optimally sized and the vCPU resource be effectively utilized by the VMs that require the most. The eG Enterprise system, using its internal calculation, intelligently arrives on the exact number of vCPUs that need to be reduced for optimally sizing the VM. This exact number will be displayed in the Remarks column.
By default, the Host column of this report will be sorted in ascending order which is indicated by an Up arrow. You can sort this report based on any column by just clicking on the column name – say for example, if you wish to sort the report based on the Number of vCPUs column, then simply clicking on the column will sort the report in descending order. Likewise you can sort the report based on any column.
-
If the Criteria chosen is Oversized VMs, Metric is chosen as CPU Usage and the Show Matching VMs Only flag is set to Yes, then this report will list only the VMs that are currently oversized (see Figure 4).
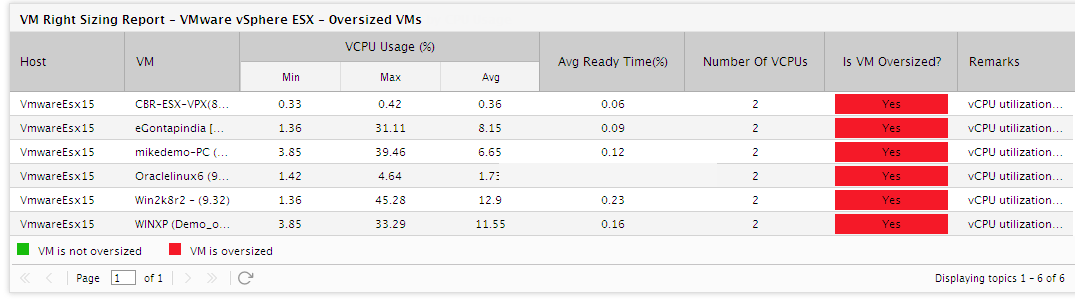
Figure 4 : The Virtual Machines Right Sizing Report showing the VMs that are currently oversized
-
For generating a report on the VMs that are undersized, pick the Undersized VMs option from the Criteria drop down list. Figure 5 shows a generated report for the VMs that are under utilized in terms of vCPU usage.
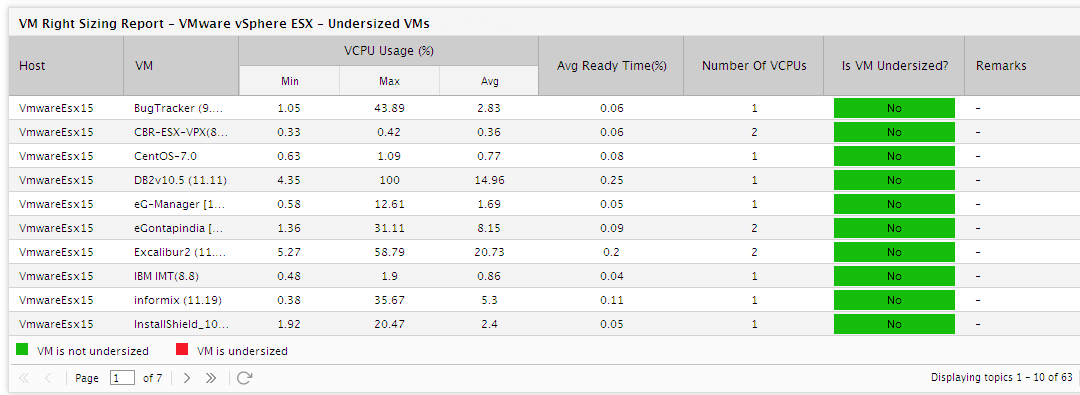
Figure 5 : The Virtual Machines - Right Sizing Report showing the VMs that are currently undersized
- If the Average vCPU utilization of a VM is considerably high and a fewer number of vCPUs are allocated for that VM, then we can conclude that the VM is currently undersized. The Remarks column of that VM will suggest you to increase the number of vCPUs allocated to the VM.
-
Similarly, this report can be generated to figure out the VMs that are undersized/oversized based on the memory utilization and GPU utilization. For example, Figure 6 shows a generated report for the virtual desktops hosted on a VMware vSphere VDI based on the GPU resources utilized by the virtual desktops.
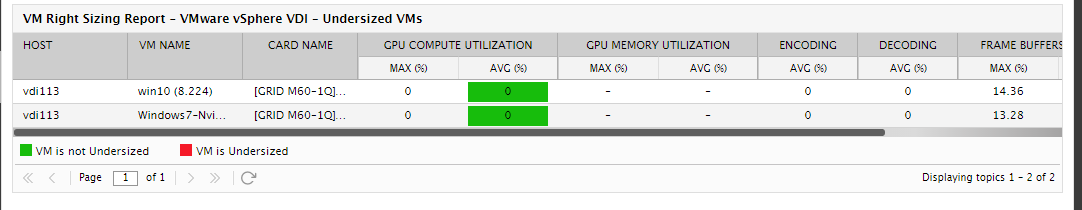
Figure 6 : The Right Sizing report showing the VMs that are undersized based on the GPU resource utilization