VM Tools Report
Citrix XenServer and VMware vSphere provide tools that must be installed on VMs to improve the functionality of the VMs – for memory management, I/O handling and so on. If the VM tools are not installed on a VM or have not been kept updated, the VMs may not be performing optimally. The VM Tools report helps administrator identify VMs on which the XenSever/vSphere Tools may not be installed or may not be updated.
In order to generate the VM Tools report, do the following:
- Select the VM Tools option by following the menu sequence: REPORTS BY FUNCTION -> Virtualization Reports-> Virtual machines -> VM Tools in the eG reporter interface.
-
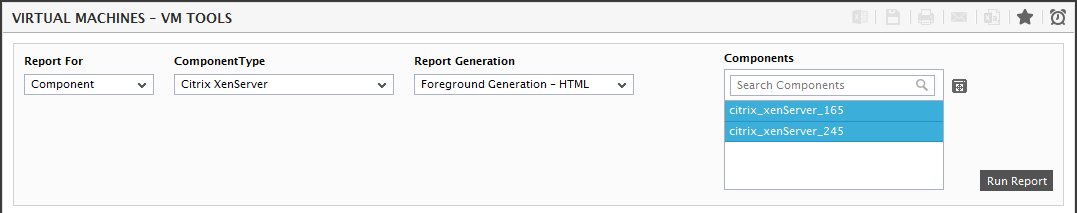
Figure 1 will then appear.
-
Next, select a criterion for analysis from the Report For list box. Using this report, you can analyze the one/more independent virtualized components, or those that are part of a segment, service, or a zone. This way, you can assess the impact of the VM Tools installed on the virtual components of a particular service/segment/zone, and accordingly take decisions. The options provided by the Report For list box are discussed hereunder:
- Component: Select this option to choose the component(s) from across all the managed components in the environment. For instance, for a report on the VM Tools hosted on all the managed Citrix Xenserver hosts in the environment, select Citrix Xenserver from the Component Type list, select Component from the Report For list, and then select all the virtual hosts listed in the Components list. If the Components list consists of too many components, then viewing all the components and selecting the ones you need for report generation could require endless scrolling. To avoid this, you can click the
 button next to the Components list. The COMPONENTS pop up window will then appear using which you can view almost all the components in a single interface and Select the ones for which the report is to be generated. You can narrow your search further by using the Search text box. Specify the whole/part of the component name to search for in this text box, and click the
  icon next to it.
 - Service: Select this option if the components for which a report is to be generated are involved in the delivery of a business service. Then, select a Service.
- Segment: Choose this option if the components to be evaluated are part of a segment. Then, pick a Segment for analysis.
- Zone: Pick this option for a report on the performance of virtual components that are included in a zone. Then, choose a Zone. A Zone drop-down list will then appear, from which you would have to select the zone to which the components of interest to you belong. An Include Subzone flag also appears. Indicate whether the components present within the sub-zones of the chosen zone are also to be to be considered for report generation, by setting the Include Subzone flag to Yes.
- Component: Select this option to choose the component(s) from across all the managed components in the environment. For instance, for a report on the VM Tools hosted on all the managed Citrix Xenserver hosts in the environment, select Citrix Xenserver from the Component Type list, select Component from the Report For list, and then select all the virtual hosts listed in the Components list. If the Components list consists of too many components, then viewing all the components and selecting the ones you need for report generation could require endless scrolling. To avoid this, you can click the
-
In large environments, reports generated using months of data can take a long time to complete. Administrators now have the option of generating reports on-line or in the background. When a report is scheduled for background generation, administrators can proceed with their other monitoring, diagnosis, and reporting tasks, while the eG manager is processing the report. This saves the administrator valuable time. To schedule background processing of a report, you can either select the Background Save - PDF option from the Report Generation list. In this case, a Report Name text box will appear, where you would have to provide the name with which the report is to be saved in the background. To process reports in the foreground, select the Foreground Generation - HTML option from this list.
Note:
- The Report Generation list will appear only if the EnableBackgroundReport flag in the [BACKGROUND_PROCESS] section of the eg_report.ini file (in the [EG_INSTALL_DIR]\manager\config directory) is set to Yes.
- The default selection in the Report Generation list will change according to the Timeline specified for the report. If the Timeline set is greater than or equal to the number of days specified against the MinDurationForReport parameter in the [BACKGROUND_PROCESS] section of the eg_report.ini file, then the default selection in the Report Generation list will be Background Save - PDF. On the other hand, if the Timeline set for the report is lesser than the value of the MinDurationForReport parameter, then the default selection in the Report Generation list will be Foreground. This is because, the MinDurationForReport setting governs when reports are to be processed in the background. By default, this parameter is set to 2 weeks - this indicates that by default, reports with a timeline of 2 weeks and above will be processed in the background.
-
Finally, click the Run Report button to generate the report.
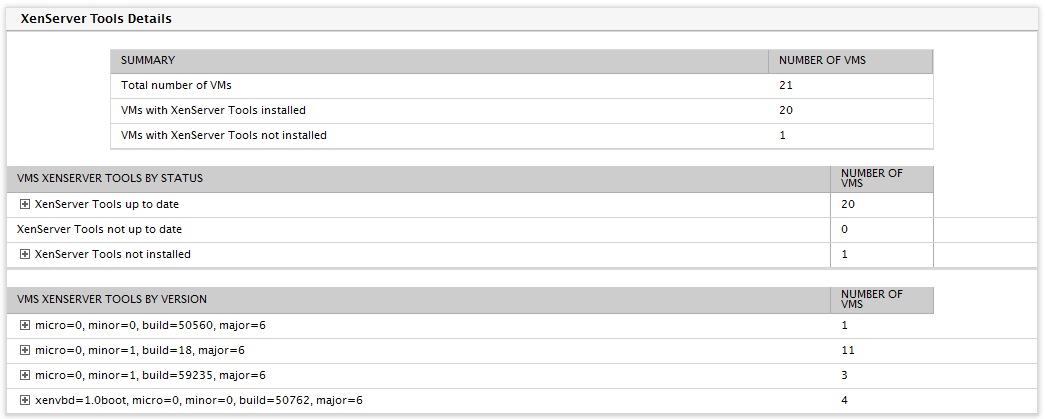
Figure 2 : A VM Tools report generated for a Citrix Xenserver
- The generated report (see Figure 2), will contain the following sections:
- A summary section that points you to the total number of VMs available in the hypervisor, the VMs on which the tools are installed and the VMs that are not installed with the tools.
-
The VM xenserver tools by status section of the report lists the number of VMs on which the latest version of the tools is installed, the number of VMs on which the version of the tools is outdated and the number of VMs on which the tools are not installed at all.
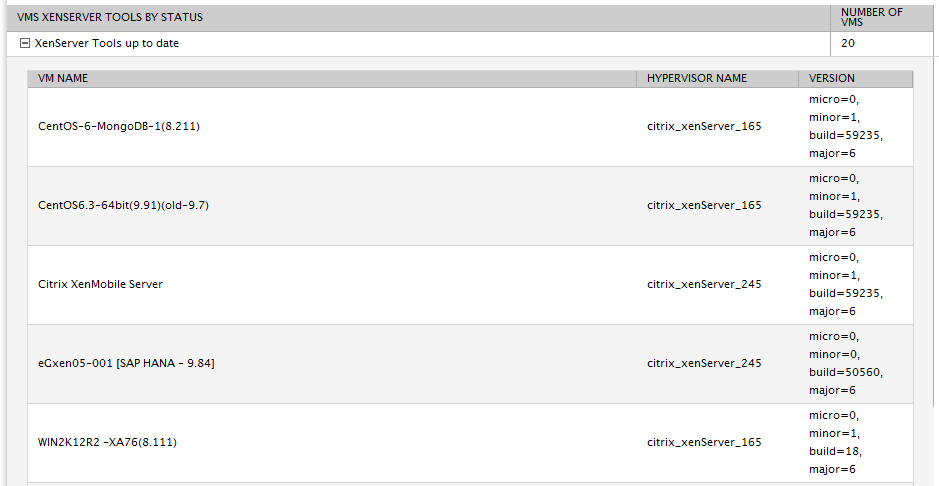
- Further drilling down the XenServer Tools up to date in the Figure 2 will provide you with the details (see Figure 3) of the VMs on which the latest version of the Tools is installed, the hypervisor on which each VM is configured and the version of the tool installed on the VM. Likewise, you can view the details of the VMs that are installed with the outdated version of the tools by clicking the XenServer Tools not up to date in the Figure 2.
-
Further drilling down the XenServer Tools not installed in the Figure 2 reveals the details of the VMs that are not installed with the Tools and the hypervisor in which those VMs are configured (see Figure 4).

Figure 4 : The details of VMs on which the Tools are not installed
-
The VMS xenserver tools by version section of the report in Figure 5 will provide you the number of VMs on which each version/build is installed. Further drilling down each version/build will reveal the name of the VM, the hypervisor on which the VM is operating, and the information on whether the VM is up to date or not.
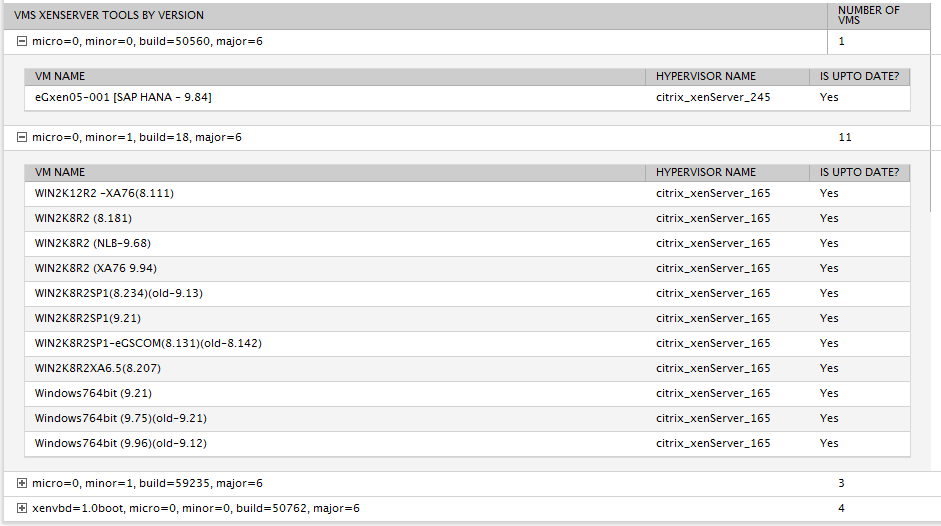
Figure 5 : The section displaying the VMs based on the VM tool build versions
-
If you have chosen VMware vSphere VDI or VMware vSphere ESX as the Component Type in Figure 1, then the report generated will be as shown in Figure 6.
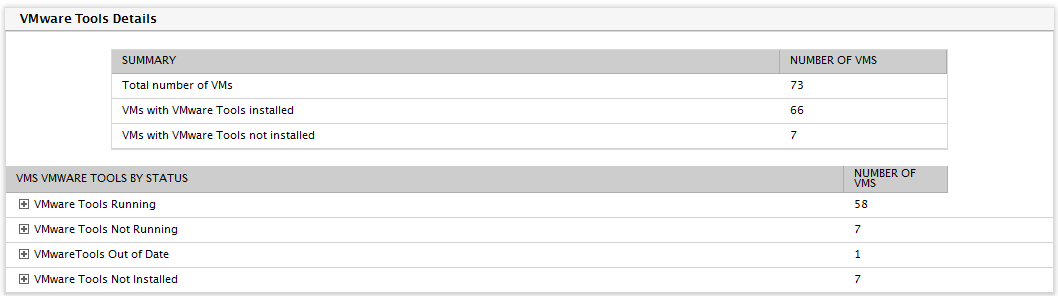
Figure 6 : The VM Tools report generated for a VMware vSphere ESX server
-
Using the vms vmware tools by status section of the report (see Figure 6), you can identify the VMs based on the status of the VMware tools and the hypervisor on which the VMs are installed. For instance drilling down the VMware Tools Running (seeFigure 7) section will list the VMs on which the VMware tools are installed and are currently running and the hypervisor on which the VMs are installed.
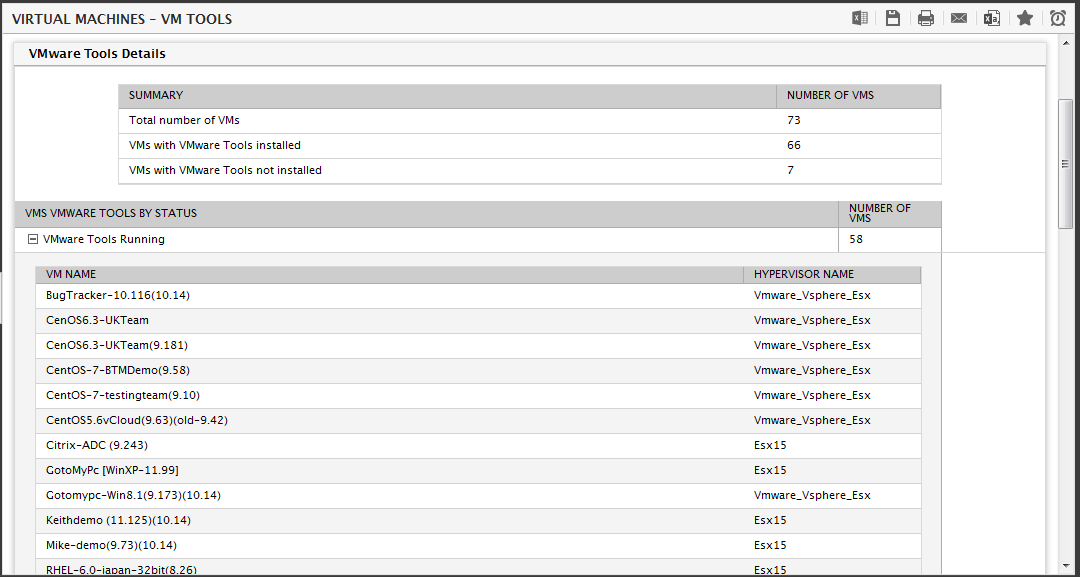
- Unlike the VM Tools report generated for the Citrix XenServer/Citrix XenServer VDI which reports the version of the XenServer Tools, the report generated for the VMware vSphere ESX/VMware vSphere VDI servers will not report the version of the VMware Tools.