Virtualization Manager - Capacity Planning Report
While planning the capacity of their virtual clusters, administrators often need to ascertain how many VMs are operating on their critical clusters, assess how these VMs are using the CPU and memory resources allocated to them, and determine whether sufficient resources are free in the cluster to support future operations. The findings from such an analysis will provide pointers to how the cluster capacity can be enhanced - can the cluster accommodate more VMs without requiring additional resources? or should the cluster be resized before adding more VMs to it?
The Cluster Capacity Planning report automates this analysis and makes prudent sizing recommendations with the help of which administrators can take accurate capacity decisions. On the basis of the historical CPU and memory usage of the VMs allocated to the cluster, the report reveals deficits in cluster sizing (if any). Also, on the basis of the free CPU and memory resources (if any) in the cluster, the report automatically computes how many more VMs the cluster can handle. In the process, the report turns the spotlight on that resource (CPU or memory) which serves as a serious constraint to expanding the VM capacity of the cluster.
To generate this report, do the following:
- Select the Capacity Planning option from the vCenter Reports node of the REPORTS BY FUNCTION tree.
-
When Figure 1 appears, first select the Report Type. For a graphical report, choose the Graph option.
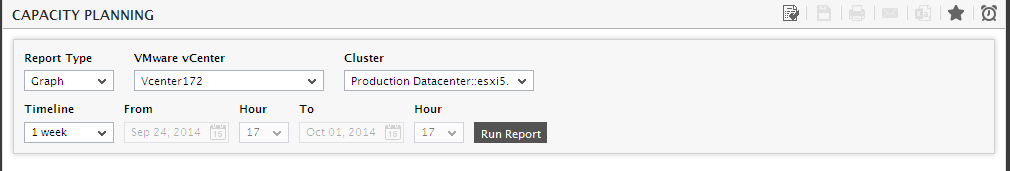
- Then, select the VMware vCenter server for which the report is to be generated.
- From the list of Clusters managed by the chosen vCenter, select the cluster for which the report is to be generated. For a report on all clusters, choose the All option.
-
Then, specify the Timeline for the graph. You can either provide a fixed time line such as 1 hour, 2 days, etc., or select the Any option from the list to provide a From and To date/time for report generation.
Note:
For every user registered with the eG Enterprise system, the administrator can indicate the maximum timeline for which that user can generate a report. Once the maximum timeline is set for a user, then, whenever that user logs into eG Reporter and attempts to generate a report, the Timeline list box in the report page will display options according to the maximum timeline setting of that user. For instance, if a user can generate a report for a maximum period of 3 days only, then 3 days will be the highest option displayed in the Timeline list - i.e., 3 days will be the last option in the fixed Timeline list. Similarly, if the user chooses the Any option from the Timeline list and proceeds to provide a start date and end date for report generation using the From and To specifications, eG Enterprise will first check if the user's Timeline specification conforms to his/her maximum timeline setting. If not, report generation will fail. For instance, for a user who is allowed to generate reports spanning over a maximum period of 3 days only, the difference between the From and To dates should never be over 3 days. If it is, then, upon clicking the Run Report button a message box will appear, prompting the user to change the From and To specification.
-
In addition to the settings discussed above, this report comes with a set of default specifications. These settings are hidden by default. If you do not want to disturb these default settings, then you can proceed to generate the report by clicking the Run Report button soon after you pick a Cluster. However, if you want to view and then alter these settings (if required), click on the
 icon. The default settings will then appear in the MORE OPTIONS drop don window (see Figure 2). The steps below discuss each of these settings and how they can be customized.
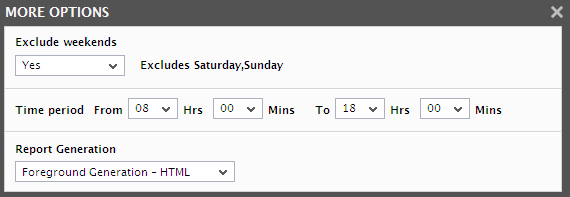
Figure 2 : The default settings for generating the Cluster Capacity Planning report
-
If the timeline specified for the report needs to exclude the data collected during the Weekends, then set Exclude weekends to Yes. If not, select No.
Note:
By default, the weekend constitutes Saturday and Sunday. To override this default setting, do the following:
- Edit the eg_report.ini file in the <eg_install_dir>\manager\config directory.
- In the [virtual_cluster] section of the file, the EXCLUDE_WEEKEND parameter is set to Saturday,Sunday by default. You can modify this by setting the exclude_weekend parameter to a comma-separated list of other days of the week - say Friday,Saturday.
- Save the file after making the required changes.
- Next, indicate the report Time period.
-
In large environments, reports generated using months of data can take a long time to complete. Administrators now have the option of generating reports on-line or in the background. When a report is scheduled for background generation, administrators can proceed with their other monitoring, diagnosis, and reporting tasks, while the eG manager is processing the report. This saves the administrator valuable time. To schedule background processing of a report, you can either select the Background Save - PDF option or the Background Save - CSV option from the Report Generation list. In this case, a Report Name text box will appear, where you would have to provide the name with which the report is to be saved in the background. To process reports in the foreground, select the Foreground Generation - HTML option from this list.
Note:
- The Report Generation list will appear only if the EnableBackgroundReport flag in the [BACKGROUND_PROCESS] section of the eg_report.ini file (in the {EG_INSTALL_DIR}\manager\config directory) is set to Yes.
- The default selection in the Report Generation list will change according to the Timeline specified for the report. If the Timeline set is greater than or equal to the number of days specified against the MinDurationForReport parameter in the [BACKGROUND_PROCESS] section of the eg_report.ini file, then the default selection in the Report Generation list will be Background Save - PDF. On the other hand, if the Timeline set for the report is lesser than the value of the MinDurationForReport parameter, then the default selection in the Report Generation list will be Foreground. This is because, the MinDurationForReport setting governs when reports are to be processed in the background. By default, this parameter is set to 2 weeks - this indicates that by default, reports with a timeline of 2 weeks and above will be processed in the background.
-
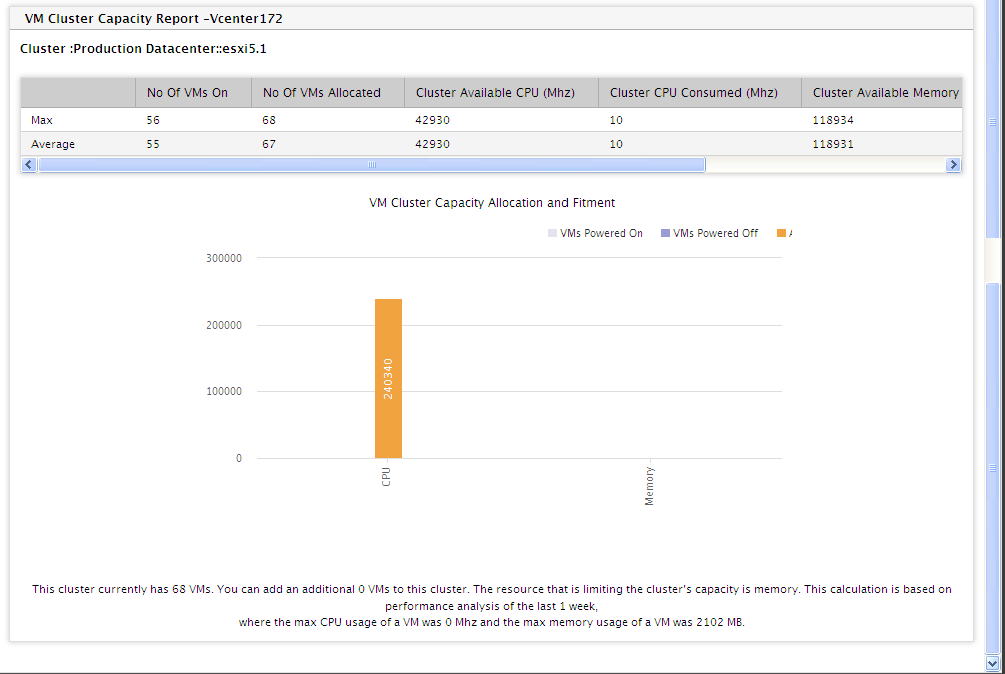
Finally, click the Run Report button. If the Report Type is Graph, then clicking the Run Report button will open Figure 3.
-
On the other hand, if the Report Type chosen is Data, then Figure 4 will appear when the Run Report button is clicked.
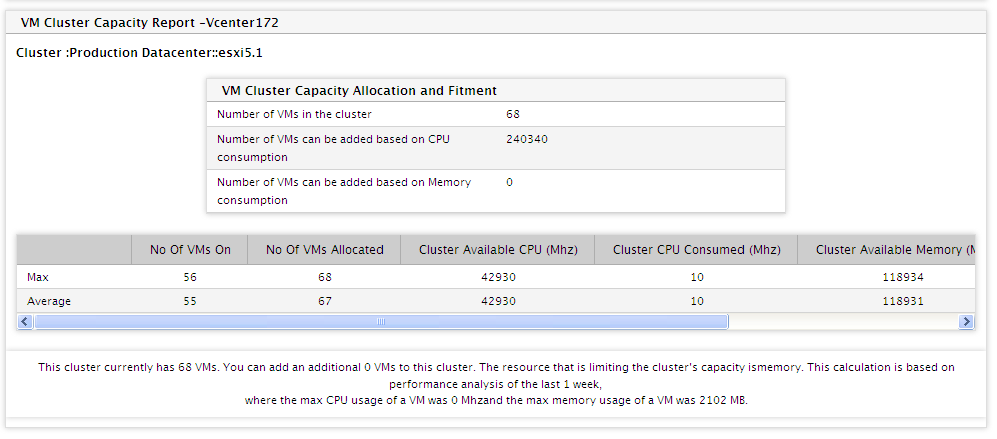
- From the reports of Figure 3 and Figure 4, you can instantly figure out how many VMs are operating on the chosen cluster, how many are powered-on currently, how the cluster utilized the CPU and memory resources allocated to it during the given timeline, and how much CPU and memory is still available for use in the cluster. In addition, the report automatically computes how many more VMs can be supported by the free CPU resources on the cluster, and represents the same graphically. Likewise, it auto-computes the additional VMs that the free memory resources of the cluster can handle, and represents the same graphically. The report also clearly states its observations and its inferences at the bottom, and also indicates which resource is limiting the cluster's VM capacity - is it CPU or memory?