Monitoring the Omnissa App Volumes Manager
eG Enterprise offers a specialized Omnissa App Volumes Manager monitoring model, which periodically monitors the license utilization, storage, AppStacks and storage groups of the Omnissa App Volumes Manager and proactively alerts administrators to potential performance troubles.
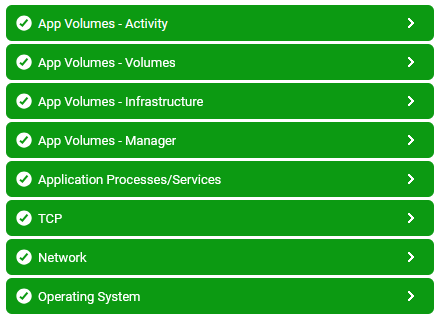
Figure 1 : Layer model of Omnissa App Volumes Manager
Each layer of the Figure 1 is mapped to a variety of tests that provide valuable insights into the overall health and performance of the target Omnissa App Volumes Manager. With the help of the metrics reported by these tests, you can find quick and accurate answers for the following queries:
- What is the availability and responsiveness of the target Omnissa App Volumes Manager?
- What is the response code returned by the HTTP / HTTPS requests?
- How many AppStacks are managed by the target Omnissa App Volumes Manager?
- How many users are logged in through the target Omnissa App Volumes Manager?
- How many server are provisioned through the target Omnissa App Volumes Manager?
- What is the status of each writable volume?
- How much of space is available for use in each writable volume?
- What is the percentage of space utilized in each writable volume? Which writable volume is currently running out of space?
- What is the status of each AppStack?
- How many users are attached to each AppStack?
- How many applications are available in each AppStack?
- How many users are accessing each AppStack?
- How many information and warning messages were received for each event type by the target Omnissa App Volumes Manager?
- How many error messages were received for each event type?
- How many jobs were delayed for each event type?
- What is the average time taken for the connections of each event type to succeed?
- How many datastores are available in each storage group?
- How much of space is available for use in each storage group?
- What is the percentage of space utilized by each storage group?
- How many AppStacks and writable volumes are available in each datastore?
- How much of space is available for use in each datastore?
- What is the percentage of space utilized by each datastore? Which datastore is currently running out of space?
- What is the validity of the license provide for the target Omnissa App Volumes Manager?
- How many user licenses are allocated and how many are currently in use?
- How many concurrent user licenses are allocated and how many are in use?
- How many terminal user licenses are allocated and how many are in use?
- How many server licenses are allocated and how many are in use?
- How many desktop licenses are allocated and how many are in use?
- Is any desktop idle in a pool? If so, which desktop pool is it?
- Are there too many inactive desktops in a pool? If so, which pool is it?
- Are all virtual desktops accessible over the network? Which desktop is not?
- How many desktops on each desktop pool were in Error state?
- How many desktops need to be maintained in each desktop pool?
- How many desktops can be accommodated in each desktop pool?
- What is the percentage of desktops that were actively used in each desktop pool?
- How many RDS Hosts exist in each application pool?
- Which application pools are currently disabled?
- What is the current status of each application pool?
- How many RDS hosts are available in each RDS farm?
- How many application pools are available in each RDS farm?
- Is each RDS farm enabled or not?
- How many sessions were initiated on the desktops/applications on each RDS farm using PCoIP, Blast and RDP protocols?
- What is the current status of each RDS host?
- How many connections can be provided to the desktops/applications on each RDS host simultaneously?
- How many Omnissa Horizon Connection Servers were enabled on the target Omnissa Horizon Cloud Pod?
- How many Omnissa Horizon Connection Servers were disabled on the target Omnissa Horizon Cloud Pod?
- How many sessions were initiated on the desktops/applications on each RDS host using PCoIP, Blast and RDP protocols?
The documentation of this monitoring model will focus on the top 4 layers of Figure 1 in detail.