
Crash Details - OS Test
Event logs on Windows VMs capture critical error conditions such as service crashes and application crashes on the VMs, application and service hangs, and service errors. Since the crash/slowness experienced by any mission-critical program/service on a Windows VM may affect the uptime of the dependent business services, administrators should be able to instantly capture these serious problem conditions, investigate the reasons for their occurrence, and promptly resolve them. This is exactly what the Crash Details -OS test helps administrators achieve! This test periodically scans the event logs on each Windows VM and reports the count of crashes, hangs, and errors that may have occurred recently on that VM. Detailed diagnostics provided by this test pinpoints the applications/services that crashed, hanged, or encountered errors, and thus enables quick and efficient troubleshooting.
Note:
This test will not report metrics on VMs running Windows 2000/2003/XP.
Target of the test : An ESX server host
Agent deploying the test : A remote agent
Outputs of the test : One set of results for every Windows VM on the vSphere/ESX server being monitored.
| Parameter | Description |
|---|---|
|
Test Period |
How often should the test be executed |
|
Host |
The host for which the test is to be configured |
|
Port |
The port at which the HOSTlistens. By default, this is NULL. |
|
ESX user and ESX password |
In order to enable the test to extract the desired metrics from a target ESX server, you need to configure the test with an ESX USER and ESX PASSWORD. The user credentials to be passed here depend upon the mechanism used by the eG agent for discovering the VMs on the target ESX server and collecting performance statistics from it. These monitoring/discovery methodologies and their corresponding configuration requirements have been discussed hereunder:
VM discovery using the vCenter in the target environment: By default, the eG agent connects to each ESX server and discovers the VMs executing on it. While this approach scales well, it requires additional configuration for each server being monitored. For example, separate user accounts may need to be created on each server for read-only access to VM details. While monitoring large virtualized installations however, the agents can be optionally configured to perform guest discovery using the VM information already available in vCenter. In this case therefore, the ESX USER and ESX PASSWORD that you specify should be that of an Administrator or Virtual Machine Administrator in vCenter. However, if, owing to security constraints, you prefer not to use the credentials of such users, then, you can create a special role on vCenter with ‘Read-only’ privileges. Refer to Assigning the ‘Read-Only’ Role to a Local/Domain User to vCenter to know how to create a user on vCenter. If the ESX server for which this test is being configured had been discovered via vCenter, then the eG manager automatically populates the ESX USER and ESX PASSWORD text boxes with the vCenter user credentials using which the ESX discovery was performed. Like ESX servers, vCenter servers too terminate user sessions based on timeout periods. The default timeout period is 30 mins. When you stop an agent, sessions currently in use by the agent will remain open for this timeout period until vCenter times out the session. If the agent is restarted within the timeout period, it will open a new set of sessions. If you want the eG agent to close already existing sessions before it opens new sessions, then you would have to configure all the tests with the credentials of a vCenter user with permissions to View and Terminate Sessions (from vCenter 4.1, this is called the View and stop sessions permission). To know how to grant this permission to a user to vCenter, refer to Creating a Special Role on vCenter and Assigning the Role to a New User. When the eG agent is started/restarted, it first attempts to connect to the vCenter server and terminate all existing sessions for the user whose credentials have been provided for the tests. This is done to ensure that unnecessary sessions do not remain established in the vCenter server for the session timeout period. Ideally, you should create a separate user account with the required credentials and use this for the test configurations. If you provide the credentials for an existing user for the test configuration, when the eG agent starts/restarts, it will close all existing sessions for this user (including sessions you may have opened using the Virtual Infrastructure client). Hence, in this case, you may notice that your VI client sessions are terminated when the eG agent starts/restarts. |
|
Confirm password |
Confirm the password by retyping it here. |
|
SSL |
By default, the ESX server is SSL-enabled. Accordingly, the SSL flag is set to Yes by default. This indicates that the eG agent will communicate with the ESX server via HTTPS by default. On the other hand, if the eG agent has been configured to use the VMPerl API or CLI for monitoring (i.e., if the ESX USER parameter is set to none), then the status of the SSL flag is irrelevant. Like the ESX sever, the vCenter is also SSL-enabled by default. If you have chosen to use the vCenter for monitoring all the ESX servers in your environment, then you have to set the SSL flag to Yes. |
|
Webport |
By default, in most virtualized environments, the ESX server and vCenter listen on port 80 (if not SSL-enabled) or on port 443 (if SSL-enabled). This implies that while monitoring an SSL-enabled ESX server directly, the eG agent, by default, connects to port 443 of the ESX server to pull out metrics, and while monitoring a non-SSL-enabled ESX server, the eG agent connects to port 80. Similarly, while monitoring an ESX server via an SSL-enabled vCenter, the eG agent connects to port 443 of vCenter to pull out the metrics, and while monitoring via a non-SSL-enabled vCenter, the eG agent connects to port 80 of vCenter. Accordingly, the WEBPORT parameter is set to 80 or 443 depending upon the status of the SSLflag. In some environments however, the default ports 80 or 443 might not apply. In such a case, against the WEBPORT parameter, you can specify the exact port at which the ESX server or vCenter in your environment listens so that the eG agent communicates with that port. |
|
Virtual Center |
If the eG manager had discovered the target ESX server by connecting to vCenter, then the IP address of the vCenter server used for discovering this ESX server would be automatically displayed against the VIRTUAL CENTER parameter; similarly, the ESX USER and ESX PASSWORD text boxes will be automatically populated with the vCenter user credentials, using which ESX discovery was performed. If this ESX server has not been discovered using vCenter, but you still want to discover the guests on the ESX server via vCenter, then select the IP address of the vCenter host that you wish to use for guest discovery from the VIRTUAL CENTER list. By default, this list is populated with the IP address of all vCenter hosts that were added to the eG Enterprise system at the time of discovery. Upon selection, the ESX USERand ESX PASSWORD that were pre-configured for that vCenter server will be automatically displayed against the respective text boxes. On the other hand, if the IP address of the vCenter server of interest to you is not available in the list, then, you can add the details of the vCenter server on-the-fly, by selecting the Other option from the VIRTUAL CENTER list. This will invoke the ADD VCENTER SERVER DETAILS page. Refer to Adding the Details of a vCenter Server for VM Discovery On the other hand, if you want the eG agent to behave in the default manner -i.e., communicate with each ESX server for monitoring and VM information - then set the VIRTUAL CENTER parameter to ‘none’. |
|
Exclude VMs |
Administrators of some virtualized environments may not want to monitor some of their less-critical VMs - for instance, VM templates - both from ‘outside’ and from ‘inside’. The eG agent in this case can be configured to completely exclude such VMs from its monitoring purview. To achieve this, provide a comma-separated list of VMs to be excluded from monitoring in the Exclude VMs text box. Instead of VMs, VM name patterns can also be provided here in a comma-separated list. For example, your exclude vms specification can be: *xp,*lin*,win*,vista. Here, the * (asterisk) is used to denote leading and trailing spaces (as the case may be). By default, this parameter is set to none indicating that the eG agent obtains the inside and outside views of all VMs on a virtual host by default. By providing a comma-separated list of VMs/VM name patterns in the Exclude VMs text box, you can make sure the eG agent stops collecting ‘inside’ and ‘outside’ view metrics for a configured set of VMs. |
|
Ignore VMs inside view |
Administrators of some high security VMware environments might not have permissions to internally monitor one/more VMs. The eG agent can be configured to not obtain the ‘inside view’ of such ‘inaccessible’ VMs using the Ignore VMs inside view parameter. Against this parameter, you can provide a comma-separated list of VM names, or VM name patterns, for which the inside view need not be obtained. For instance, your ignore vms inside view specification can be: *xp,*lin*,win*,vista. Here, the * (asterisk) is used to denote leading and trailing spaces (as the case may be). By default, this parameter is set to none indicating that the eG agent obtains the inside view of all VMs on an ESX host by default. Note: While performing VM discovery, the eG agent will not discover the operating system of the VMs configured in the Ignore VMs inside view text box. |
|
Ignore winnt |
By default, the eG agent does not support the inside view for VMs executing on Windows NT operating systems. Accordingly, the ignore winnt flag is set to Yes by default. |
|
Inside view using |
By default, this test obtains the “inside view” of VMs using the eG VM Agent. Accordingly, the Inside view using flag is set to eG VM Agent by default. The eG VM Agent is a piece of software, which should be installed on every VM on a hypervisor. Every time the eG agent runs this test, it uses the eG VM Agent to pull relevant 'inside view' metrics from each VM. Once the metrics are collected, the eG agent then communicates with each VM agent and pulls these metrics, without requiring administrator privileges. Refer to Configuring the Remote Agent to Obtain the Inside View of VMs for more details on the eG VM Agent. |
|
Domain, Admin User, and Admin Password, and Confirm Password |
By default, these parameters are set to none. This is because, by default, the eG agent collects 'inside view' metrics using the eG VM agent on each VM. Domain administrator privileges need not be granted to the eG agent if it uses this default approach to obtain the 'inside view' of Windows VMs. |
|
Exclude IP |
Typically, when performing VM discovery, the eG agent automatically discovers the operating system on which every VM runs, and all the IP addresses that each VM supports. If two are more VMs on a target vSphere server are in a VM cluster, then the eG agent will also auto-discover the cluster IP address. Since the cluster IP address is shared by all VMs in the cluster, this IP address will be in the discovery list of every VM in the cluster. In this case, if the eG agent attempts to obtain the 'inside view' of each VM in a cluster using their cluster IP address, incorrect metrics may be reported sometimes. To avoid this, you may want to instruct the eG agent to not use the cluster IP address when collecting 'inside view' metrics. For this, specify a comma-separated list of cluster IP addresses to be excluded in the EXCLUDE IP text box. |
|
Report By User |
This flag is set to Yes by default. The value of this flag cannot be changed. This implies that the virtual machines in VDI environments will always be identified using the login name of the user. In other words, in VDI environments, this test will, by default, report measures for every username_on_virtualmachinename. |
|
Report Powered OS |
This flag becomes relevant only if the REPORT BY USERflag is set to ‘Yes’ If the REPORT POWERED OS flag is set to Yes (which is the default setting), then this test will report measures for even those VMs that do not have any users logged in currently. Such guests will be identified by their virtualmachine name and not by the username_on_virtualmachinename. On the other hand, if the REPORT POWERED OS flag is set to No, then this test will not report measures for those VMs to which no users are logged in currently. |
|
Ignore Applications Or Services |
By default, this parameter is set to none. This means that the test will monitor all applications and services running on the VM, and will alert you every time any of these applications/services crash or hang. If you want to exclude specific applications/services on the VMs from the monitoring scope of this test, then provide a comma-separated list of application/service names here. |
|
DD Frequency |
Refers to the frequency with which detailed diagnosis measures are to be generated for this test. The default is 1:1. This indicates that, by default, detailed measures will be generated every time this test runs, and also every time the test detects a problem. You can modify this frequency, if you so desire. Also, if you intend to disable the detailed diagnosis capability for this test, you can do so by specifying none against DD FREQUENCY. |
|
Detailed Diagnosis |
To make diagnosis more efficient and accurate, eG Enterprise embeds an optional detailed diagnostic capability. With this capability, the eG agents can be configured to run detailed, more elaborate tests as and when specific problems are detected. To enable the detailed diagnosis capability of this test for a particular server, choose the On option. To disable the capability, click on the Off option. The option to selectively enable/disable the detailed diagnosis capability will be available only if the following conditions are fulfilled:
|
| Measurement | Description | Measurement Unit | Interpretation |
|---|---|---|---|
|
Recent application crashes |
Indicates the number of application crash events that occurred on this VM during the last measurement period. |
Number |
An event with the ID 1000 is logged in the event log every time a program terminates unexpectedly on a virtual desktop. This measure reports the number of events in the event log with event ID 1000. Use the detailed diagnosis of this measure to know which programs and modules stopped suddenly. |
|
Recent service crashes |
Indicates the number of service crash events that occurred on this VM during the last measurement period. |
Number |
An event with the ID 7031 is logged in the Service Control Manager every time a service terminates ungracefully. This measure reports the number of events in the event log with event ID 7031. Use the detailed diagnosis of this measure to know the complete details of such events. |
|
Recent application hangs |
Indicates the number of application hang events that occurred on this VM during the last measurement period. |
Number |
An event with the ID 1002 is logged in the Application Event Log every time an application hangs. This measure reports the number of events in the event log with event ID 1002. Use the detailed diagnosis of this measure to know the complete details of the recent application hang events. |
|
Recent service hangs |
Indicates the number of service hang events that occurred on this VM during the last measurement period. |
Number |
An event with the ID 7022 is logged in the Service Control Manager every time a service hangs. This measure reports the number of events in the event log with event ID 7022. Use the detailed diagnosis of this measure to know the complete details of the recent service hang events. |
|
Recent service errors |
Indicates the number of service errors that occurred on this VM during the last measurement period. |
Number |
Events with the ID 7023, 7024, and 7026 are logged in the Service Control Manager every time a service error occurs. This measure reports the number of events in the event log with the aforesaid event IDs. Use the detailed diagnosis of this measure to know the complete details of the recent service errors. |
If you click on the 'right arrow' at the end of the Inside View of VMs layer of a managed VMware vSphere ESX server, you can see the tests mapped to that layer (see Figure 1).
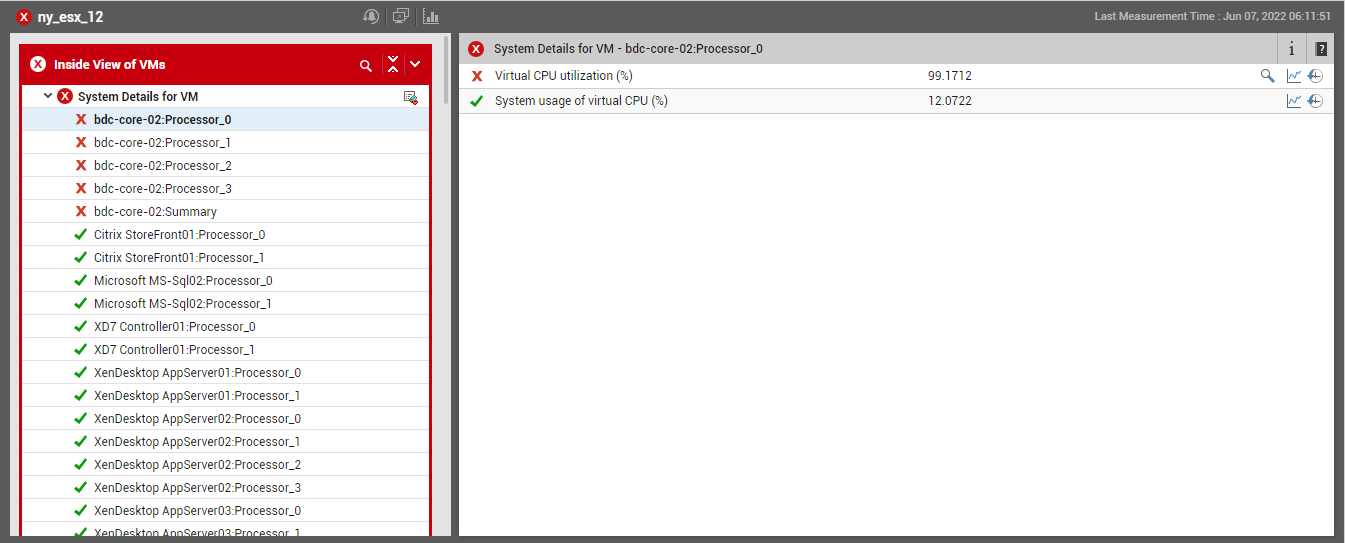
Figure 1 : The tests mapped to the Inside View of VMs layer of a VMware vSphere ESX server
On the other hand, if you click on the Inside View of VMs layer itself, you will be lead to the Servers View (see Figure 2),where you will find all the VMs on the target vSphere server listed.
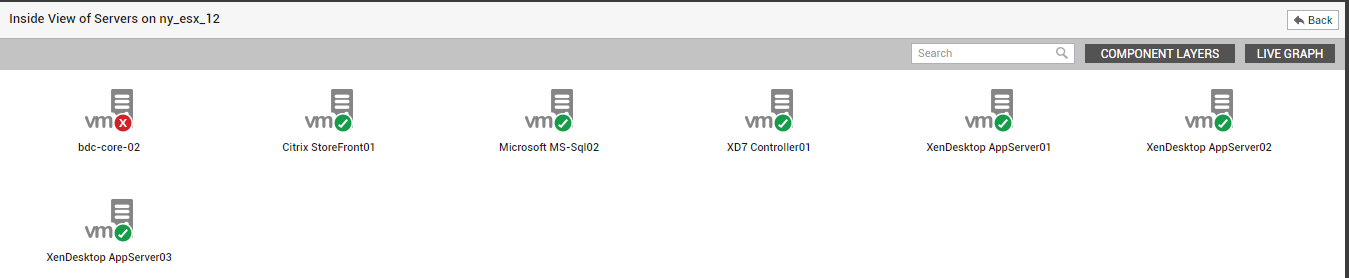
Figure 2 : The Servers View revealing the VMs on the target vSphere server
Clicking on any of the guests in the Server view leads you to Figure 3 that displays all the performance metrics extracted from that guest, in real-time. In the Measures dashboard of , these 'inside view' metrics are logically grouped into 2 tab pages, namely - VM Operating Systemand Network/TCP. To know more about the Measures dashboard and the tab pages it contains, refer to The Measures Dashboard
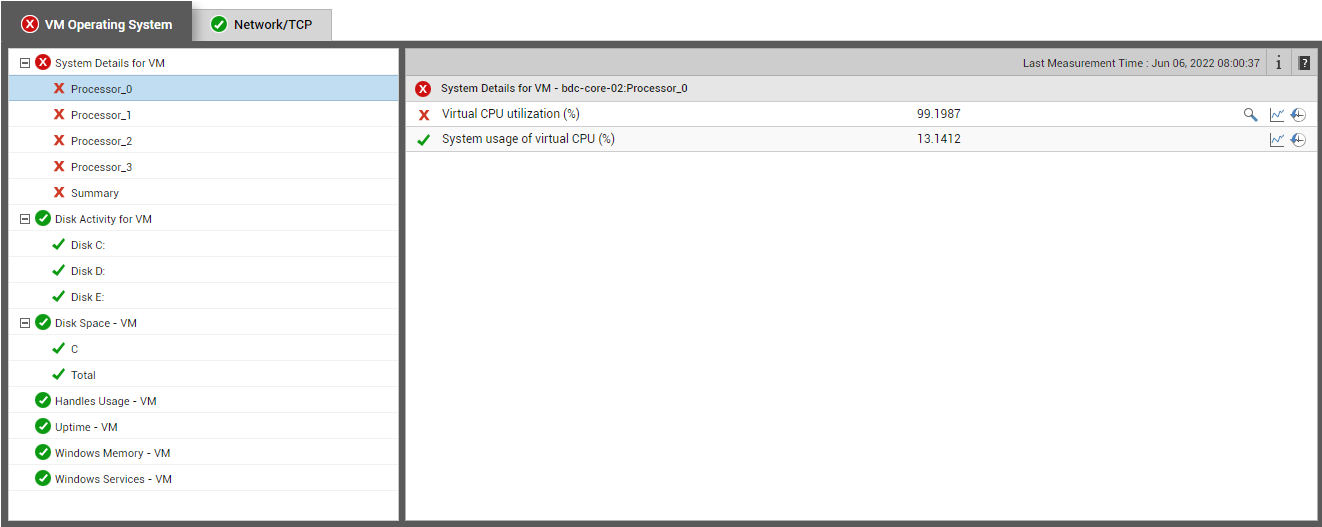
Figure 3 : Measures pertaining to a chosen VM on a VMware vSphere ESX server
To view real-time graphs of pre-configured measures (pertaining to the ESX host and the guests operating on it), click on the live graph button in Figure 1. Alternatively, you can click on the  icon that appears adjacent to the Outside View of VMs layer when it is clicked. The graph display that appears subsequently (see Figure 4) has been organized in such a way that next to every host-pertinent measure graph, the closely related guest-specific measure graph appears. For instance, next to the graph of the ‘Physical CPU usage’ measure of the CPU - Esx test, you will find a graph of the ‘Physical CPU used’ measure of the Virtual Machines - ESX test. This way, you can easily compare and correlate how well the physical CPU resources are being utilized by both the ESX host and the guests. On the basis of this analysis, you can proactively isolate potential performance issues, and also determine the root-cause of the issue - is it the ESX host? or is it the virtual guest? If you access this page from the LIVE GRAPHbutton in Figure 1, then, by default, you will view live graphs pertaining to the VMware vSphere ESX server. However, you can select a different virtualized component-type and a different virtualized component using the type and ComponentName lists (respectively) in Figure 4.
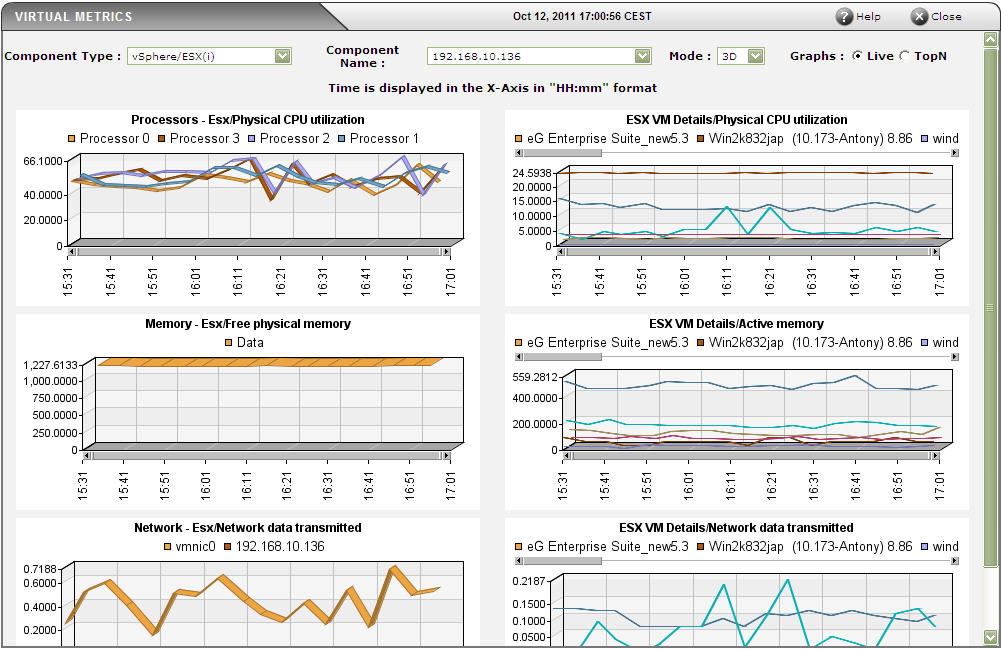
Figure 4 : Live graph of the VMware vSphere ESX server
Also, using the eG Enterprise administration console, administrators can add applications running on the VM guests for monitoring. To monitor these applications, agents can be installed in the VM guests, or an agentless monitoring approach can be used. To effectively monitor the applications running in a virtual environment, it is important to be able to determine which ESX server an application is running. This mapping of applications to ESX servers is important for root-cause diagnosis - for example, a problem with the ESX server (e.g., excessive disk slowdowns) can impact the performance of all the applications running on the server’s virtual machines. eG Enterprise is able to automatically determine the mapping of applications to ESX servers.
Whether eG Enterprise automatically determines the mapping of applications to ESX servers or not is determined by the value of the AutoVirtualMapping variable in the [MISC] section of the eg_external.ini configuration file in the <EG_INSTALL_DIR>\manager\config directory of the eG manager. If the value of this variable is true, the eG manager auto-discovers the applications to ESX servers mapping.
Note:
- For AutoVirtualMapping to work, the detailed diagnosis frequencies set globally (i.e., using the Configure -> Diagnosis menu sequence) should not be set to 0:0.
- As long as the Identify agents only using nick names flag in the manager settings page of the eG administrative interface (Configure -> Manager Settings menu sequence) is Yes (which is the default), eG Enterprise can automatically identify the server applications executing on an ESX host, using the host/nick names that are mapped to the IP addresses discovered on the host. If the Identify agents only using nick names flag is set to No instead, then make sure that, while managing a server application executing in a virtualized environment, the hostname of the virtual machine is specified as the nick name of the corresponding server application. If more than one server application is executing on the same virtual machine, then any one of those server applications should have the virtual machine name as its nick name.
To disable auto-discovery, set this value to false. In such a case, once a VMware vSphere ESX or a VMware ESX server is added, then, when adding any new server application using the eG administrative interface, you will be prompted to manually set an association between the server application being added and the ESX server. In the example depicted by Figure 5, the Virtual Environmentflag is turned on, indicating that the Microsoft SQL server is running on a guest operating system. The name of the virtual host on which the component is hosted is indicated in the Virtual Servers selection.
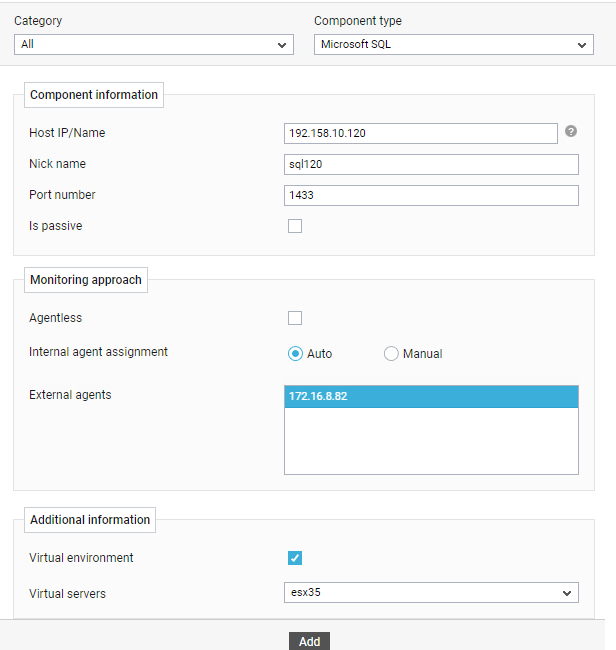
Figure 5 : Adding a server application to a virtual environment
The mapping of applications to ESX servers is used by eG Enterprise for correlation - e.g., since the application runs on the ESX server, it is most likely that a problem with the ESX server will impact the performance of the application running on one of the guests. To view this application-ESX server association, simply click on the Virtual Topology icon indicated by Figure 6.
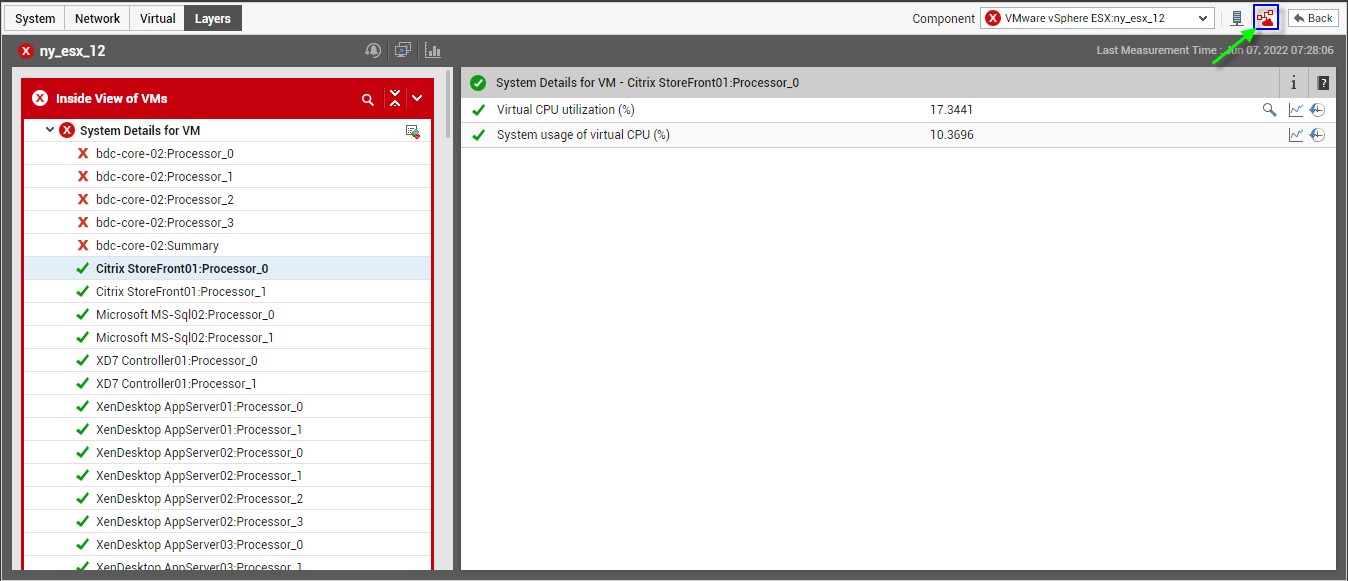
Figure 6 : Clicking on the Virtual Topology icon
Note:
The Virtual Topology icon will also be available in the layer model page of those server applications that are executing on virtual guests.
Doing so reveals Figure 7 depicting the VMware vSphere ESX sever and the server applications executing on it. By clicking on any of the components in Figure 7, the user can drill down into specific layers of this component for specific details on the performance of the component.
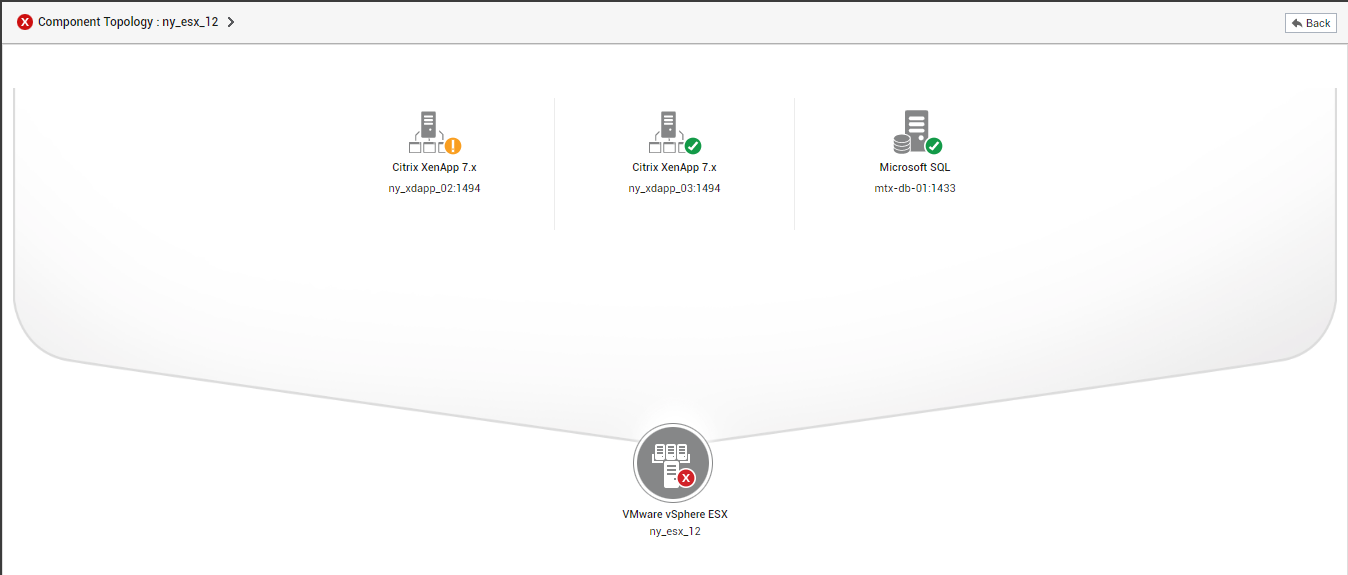
Figure 7 : Depicts the applications that have been deployed on the guest OS of an ESX server
Since the applications are hosted on one of the guests running on the ESX host, they depend on the ESX host - i.e., any unusual resource usage on the ESX host impacts the applications running on any of the virtual guests. The dependency information between the ESX host and the applications hosted on it is used by eG Enterprise for end-to-end correlation.
