The Current Events Tab Page
The Current Events tab page lists the problems that are currently affecting the performance of managed virtual hosts and virtual machines executing on them. This tab page enables administrators to focus on issues related to their virtualized environment alone, without being distracted by the “non-virtual” issues.
As stated earlier, this tab page, by default, lists the alarms pertaining to those virtual hosts that are of type VMware vSphere ESX.
Like the other tab pages, the Current Events tab page too changes with respect to the node chosen from the tree-structure. To see how, read on.
-
If the global Zones node is selected in the left panel, then the Current Events tab page in the right panel will list the problems that are adversely impacting the performance of the virtual hosts of the chosen type across the environment (see Figure 2). This list is typically sorted by event priority. If event priority is the same across events, then the events are arranged in the order of the names of the problem hosts. The details provided here include the name of the problem component, a brief description of the problem, and the time at which the problem was reported. This information enables administrators to understand how problem-prone their virtualized environment is, and also provides them with pointers to the root-cause of the problem.
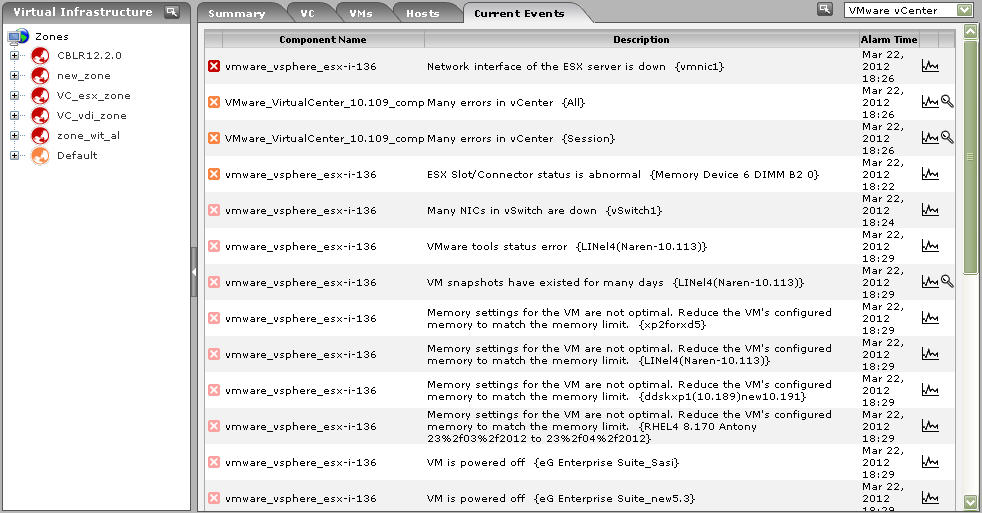
Figure 1 : The Current Events tab for the global Zones node
- Now, let us see what happens if a particular zone is chosen from the tree-structure in the left panel. When this is done, the Current Events list in the right panel will change to display the problems related to those virtual hosts that are included in the zone that is clicked on. This information helps administrators identify those problems that are affecting the performance of a particular zone.
-
If you then drill down a particular zone in the tree, you will be able to view the virtual component-types that form part of the zone, and their current state. If you click on a particular component-type in the tree, the Current Events tab page in the right panel will allow you to view the problems related to virtual hosts of that type that are included in the corresponding zone (see Figure 2).
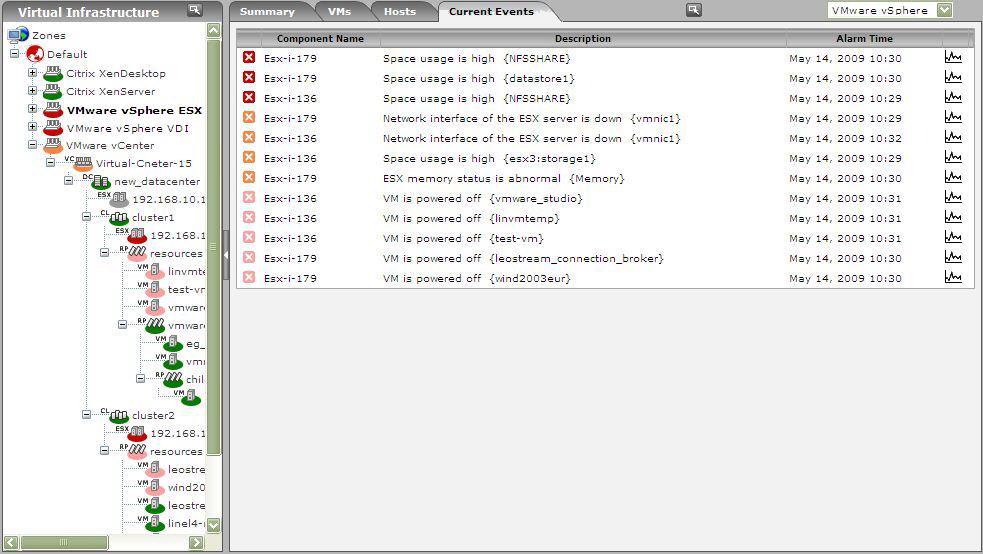
Figure 2 : The Events tab page for a virtual component type in the tree
- If the vCenter servers in your environment are being monitored as part of a zone, then expanding that zone’s node in the tree would reveal the VMware vCenter component-type. When this component-type is clicked on, the Current Events tab page will change to display the problem events pertaining all the vCenter servers included in that zone, and those that correspond to the ESX servers managed and VMs by every vCenter server in the zone.
-
To know which vCenter servers have been added to a zone, just expand the VMware vCenter sub-node under the zone node in the tree. This will reveal the name and the current state of the vCenter servers in that zone. Clicking on a particular vCenter server in the tree will display problem events pertaining to that vCenter component and those that relate to ESX servers and VMs managed by that vCenter, in the Current Events tab page.
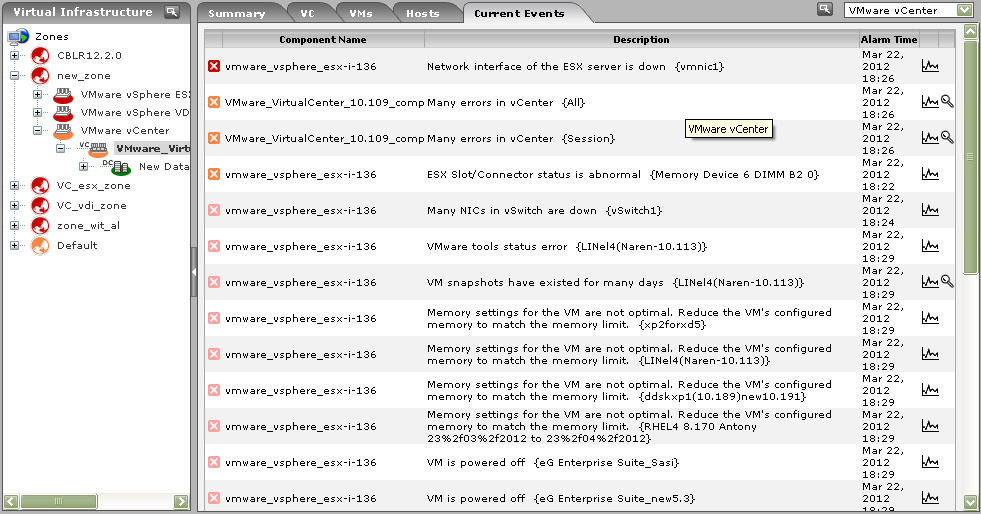
Figure 3 : The Events tab page for a vCenter server chosen from the tree
-
Typically, when you expand a vCenter server node in the tree, the physical ESX servers that are being managed by that vCenter server will appear.
Note:
While the vCenter server tree will list even those ESX servers that are not monitored by eG Enterprise, the tree will not indicate the current state of such servers; also, clicking on any such server will not display corresponding performance information in the tab pages in the right panel.
However, in some environments, folders may be configured on vCenter server, where every folder could contain one/more datacenters, ESX servers, clusters, datastores, and VMs. In such cases, expanding the vCenter server node will reveal the folders configured on that vCenter server as sub-nodes. Clicking on a folder sub-node will display the complete list of problems currently affecting the performance of datacenters, clusters, ESX servers, and VMs that are included in that folder in the Current Events tab page (see Figure 4).
-
Expanding the folder node will reveal the datacenters within that folder. If no folders exist, then expanding a vCenter server node in the tree, will display the datacenters that have been configured within a vCenter. To know what problems are affecting the performance of a particular datacenter currently, click on the node representing a datacenter in the tree. Figure 5 then appears.
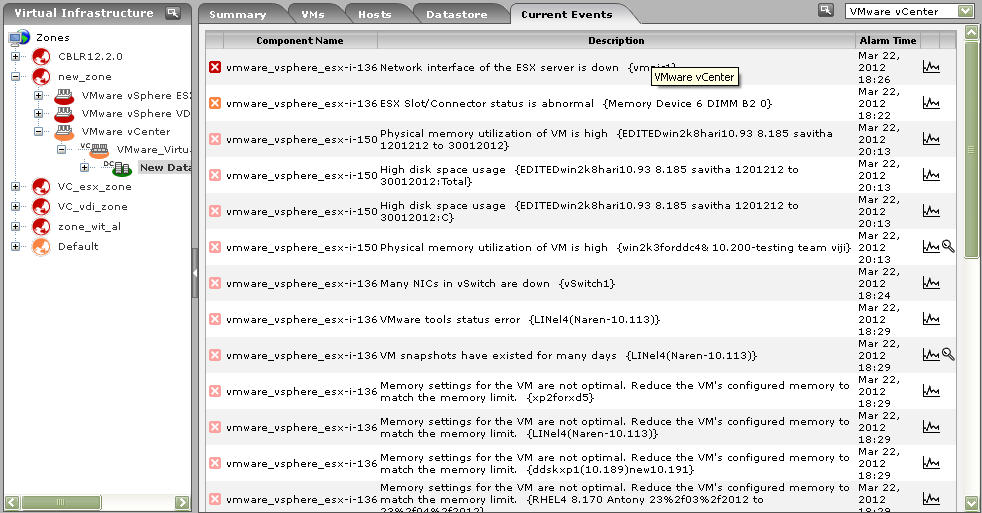
Figure 5 : The Events tab page for a datacenter chosen from the tree
-
Every datacenter, in turn, may manage clusters of ESX servers. If such clusters have been configured on any monitored vCenter server, then, in the Virtual Infrastructure tree, these clusters will appear as sub-nodes of that datacenter node. If you click on a cluster sub-node in the tree, the Current Events tab page will reveal the problem events pertaining to all managed ESX servers included in the cluster.
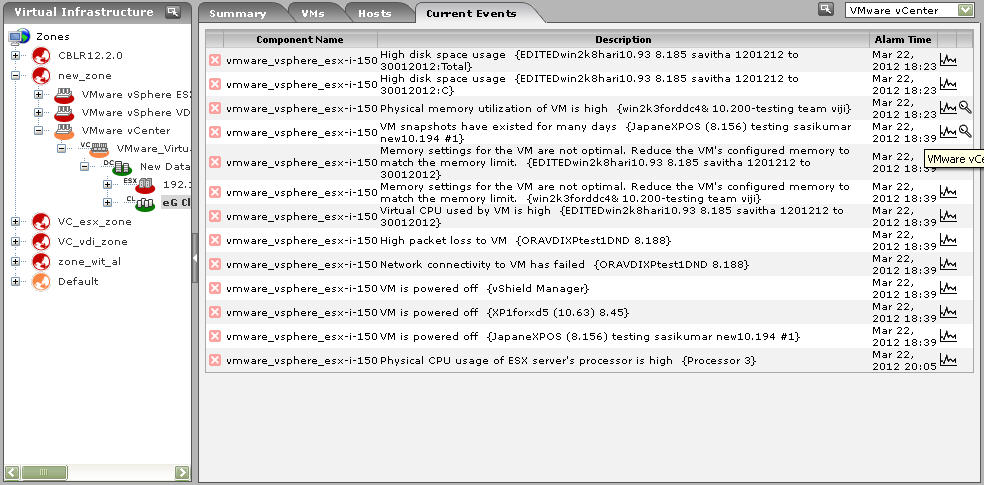
Figure 6 : The Current Events tab page for a cluster
-
To view the individual virtual hosts that are part of a zone, do any of the following
- Expand the nodes representing the virtual component-types in the zone;
- If the zone consists of components of type VMware vCenter, expand the node representing the monitored vCenter server in your environment;
- If datacenters are configured on a monitored vCenter server, expand a datacenter sub-node under the vCenter server node;
- If clusters are configured within a datacenter, expand the cluster sub-node;
-
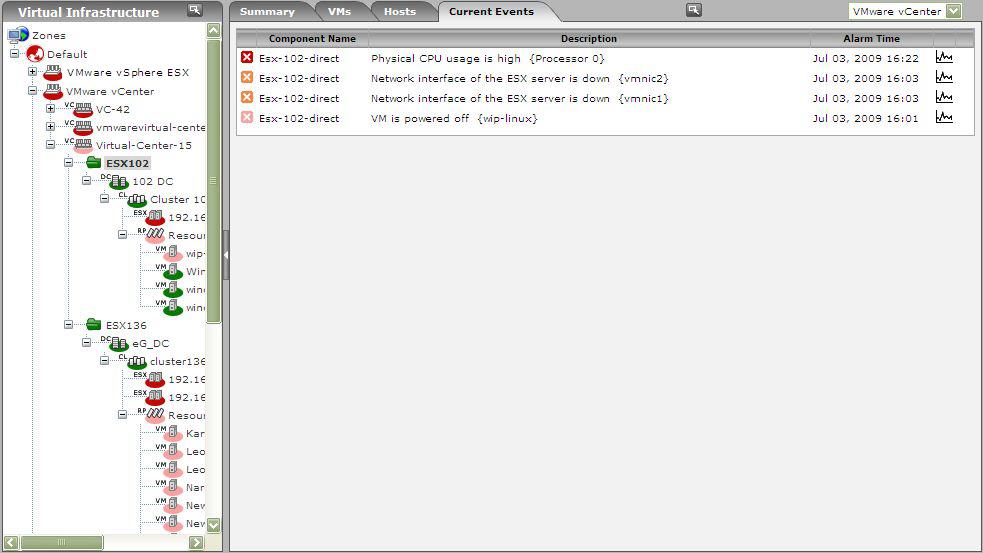
If you then click on a virtual host in the tree, the Current Events tab page will change to display problems affecting that virtual host (see Figure 7).
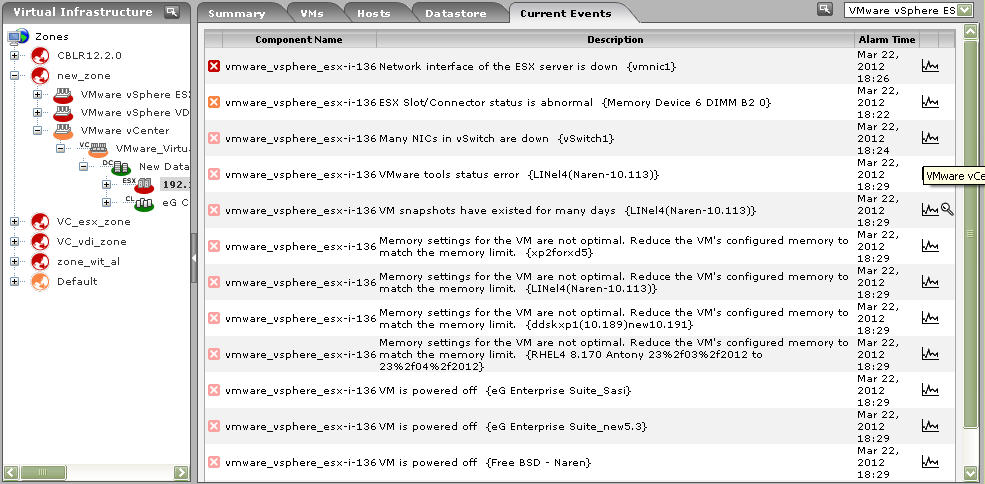
Figure 7 : The Events tab page for a particular virtual host selected from the tree
- Similarly, if you expand the virtual host node in the tree-structure, you can view the name and state of those VMs that are executing on that virtual host. If you now click on a VM in the tree, the problem affecting that VM alone will be displayed in this tab page.
- If resource pools are configured on a virtual host, then the resource pools also will appear as the sub-nodes of the virtual host-node. If you click on a resource pool in the tree, the corresponding Current Events tab page will list the current problems affecting the performance of one/more virtual machines included in the resource pool.
- To perform additional diagnostics on one of the problems listed in this tab page, you can click on the corresponding Graph icon. A graph of the problem measure for the last 1 hour (by default) will then appear revealing when exactly the problem occurred.
-
Clicking on an event listed in this tab page will lead you to the layer model page of the problem component, using which you can quickly determine the problem layer, test, and measure.
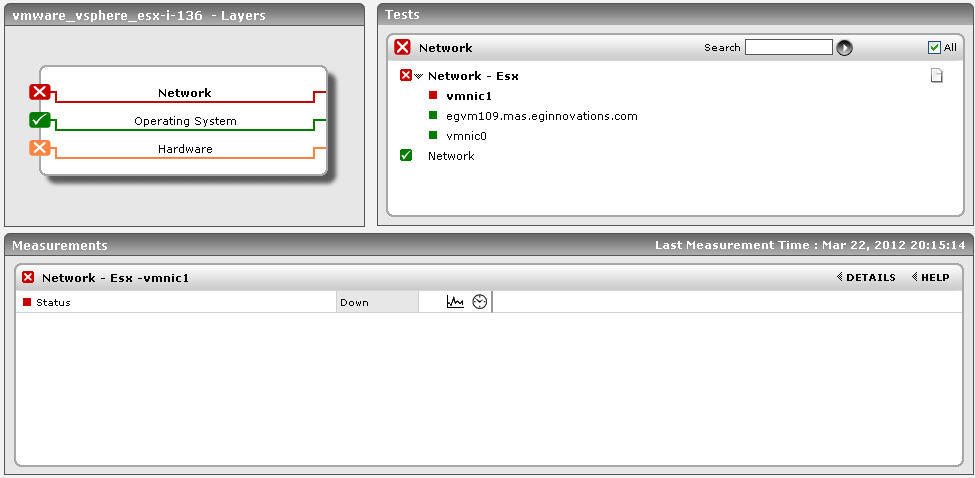
Figure 8 : The problem layer, test, and measure of the problem component