vCenter Alarms with Policy Test
vSphere includes a user-configurable events and alarms subsystem. This subsystem tracks events happening throughout vSphere and stores the data in log files and the vCenter Server database. This subsystem also enables you to specify the conditions under which alarms are triggered. Alarms can change state from mild warnings to more serious alerts as system conditions change, and can trigger automated alarm actions. This functionality is useful when you want to be informed, or take immediate action, when certain events or conditions occur for a specific inventory object, or group of objects.
Alarms are notifications that are activated in response to an event, a set of conditions, or the state of an inventory object. An alarm definition consists of the following elements in the vSphere Client:
-
Name and description - Provides an identifying label and description.
-
Targets - Defines the type of object that is monitored.
-
Alarm Rules - Defines the event, condition, or state that triggers the alarm and defines the notification severity. It also defines operations that occur in response to triggered alarms.
-
Last modified - The last modified date and time of the defined alarm.
Alarm definitions are associated with the object selected in the inventory. An alarm monitors the type of inventory objects specified in its definition. Alarm actions are operations that occur in response to the trigger. For example, you can have an email notification sent to one or more administrators when an alarm is triggered. Alarms triggered on a selected inventory object are visible in several locations throughout the VMware vSphere Client and the vCenter console.
In a virtual environment, there may be multiple administrators who are assigned different tasks. To ensure that the administrators are notified only for those alarms that are triggered for their assigned tasks, administrators can filter the alarms based on a defined policy. If an administrator misses to notice an alarm triggered for a specific policy and resolve it on time, it may have a huge impact on the performance of the target environment. To enable administrators notice all the alarms triggered based on policies in the target environment without a miss, administrators can use the vCenter Alarms with Policy test.
This test when executed periodically enables the eG agent to read the alarms triggered and logged in the vCenter alarm console and filter the alarms based on the policies defined. For each defined policy, this test reports the count of alarms that are currently triggered and also the reports the count of informational alarms, critical alarms etc. Administrators can use the detailed diagnostics to identify the exact alarms that were triggered for each policy and initiate troubleshooting to resolve the alarms at the earliest. This way, administrators can figure out the policy for which maximum alarms were triggered.
Note:
This test is disabled by default. To enable the test, go to the enable / disable tests page using the menu sequence : Agents -> Tests -> Enable/Disable, pick the desired Component type, set Performance as the Test type, choose the test from the DISABLED TESTS list, and click on the << button to move the test to the ENABLED TESTS list. Finally, click the Update button.
Target of the test : A VMware vCenter server
Agent deploying the test : An internal agent
Outputs of the test : One set of results for each alarm policy filter configured on the target VMware vCenter server being monitored
| Parameter | Description |
|---|---|
|
Test Period |
How often should the test be executed. |
|
Host |
The host for which this test is to be configured. |
|
Port |
Refers to the port at which the specified host listens to. |
|
VC User and VC Password |
To connect to vCenter and extract metrics from it, this test should be configured with the name and password of a user with Administrator or Virtual Machine Administrator privileges to vCenter. However, if, owing to security constraints, you are not able to use the credentials of such users for test configuration, then you can configure this test with the credentials of a user with Read-only rights to vCenter. For this purpose, you can assign the ‘Read-only’ role to a local/domain user to vCenter, and then specify name and password of this user against the VC User and VC Password text boxes. The steps for assigning this role to a user on vCenter have been detailed in vCenter servers terminate user sessions based on timeout periods. The default timeout period is 30 mins. When you stop an agent, sessions currently in use by the agent will remain open for this timeout period until vCenter times out the session. If the agent is restarted within the timeout period, it will open a new set of sessions. If you want the eG agent to close already existing sessions on vCenter before it opens new sessions, then, instead of the ‘Read-only’ user, you can optionally configure the VC User and VC Password parameters with the credentials of a user with permissions to View and Stop Sessions on vCenter. For this purpose, you can create a special role on vCenter, grant the View and Stop Sessions privilege (prior to vCenter 4.1, this was called the View and Terminate Sessions privilege) to this role, and then assign the new role to a local/domain user to vCenter. The steps for assigning this role to a user on vCenter have been detailed in |
|
Confirm Password |
Confirm the password by retyping it in this text box. |
|
VC Alarm Filter |
Name of the filter based on which the Virtual Center alarms should be filtered. More than one policy filter name can be provided against this text box. To save the time and effort involved in adding/modifying policy filters, eG Enterprise offers an easy-to-use Add/Modify Policy Filters option in the form of a |
|
SSL |
By default, the vCenter server is SSL-enabled. Accordingly, the SSL flag is set to Yes by default. This indicates that the eG agent will communicate with the vCenter server via HTTPS by default. |
|
Webport |
By default, in most virtualized environments, vCenter listens on port 80 (if not SSL-enabeld) or on port 443 (if SSL-enabled) only. This implies that while monitoring vCenter, the eG agent, by default, connects to port 80 or 443, depending upon the SSL-enabled status of vCenter – i.e., if vCenter is not SSL-enabled (i.e., if the SSL flag above is set to No), then the eG agent connects to vCenter using port 80 by default, and if vCenter is SSL-enabled (i.e., if the ssl flag is set to Yes), then the agent-vCenter communication occurs via port 443 by default. Accordingly, the Webport parameter is set to default by default. In some environments however, the default ports 80 or 443 might not apply. In such a case, against the Webport parameter, you can specify the exact port at which vCenter in your environment listens, so that the eG agent communicates with that port for collecting metrics from vCenter. |
|
Show DD For INFO Alarms |
By default, this flag is set to No indicating that detailed metrics will not be collected by default for the Info alarms measure reported by this test. If you wish this test to report detailed diagnostics for the Info alarms measure, set this flag to Yes. |
|
Show DD For UNKNOWN Alarms |
By default, this flag is set to No indicating that detailed metrics will not be collected by default for the Unknown alarms measure reported by this test. If you wish this test to report detailed diagnostics for the Unknown alarms measure, set this flag to Yes. |
|
Show DD For WARNING Alarms |
By default, this flag is set to Yes indicating that detailed metrics will be collected and reported as part of detailed diagnosis for the Warning alarms measure reported by this test. If you do not wish to report detailed diagnostics for the Warning alarms measure, set this flag to No. |
|
Show DD For CRITICAL Alarms |
By default, this flag is set to Yes indicating that detailed metrics will be collected and reported as part of detailed diagnosis for the Critical alarms measure reported by this test. If you do not wish to report detailed diagnostics for the Critical alarms measure, set this flag to No. |
|
DD Frequency |
Refers to the frequency with which detailed diagnosis measures are to be generated for this test. The default is 1:1. This indicates that, by default, detailed measures will be generated every time this test runs, and also every time the test detects a problem. You can modify this frequency, if you so desire. Also, if you intend to disable the detailed diagnosis capability for this test, you can do so by specifying none against DD frequency. |
|
Detailed Diagnosis |
To make diagnosis more efficient and accurate, the eG Enterprise embeds an optional detailed diagnostic capability. With this capability, the eG agents can be configured to run detailed, more elaborate tests as and when specific problems are detected. To enable the detailed diagnosis capability of this test for a particular server, choose the On option. To disable the capability, click on the Off option. The option to selectively enable/disable the detailed diagnosis capability will be available only if the following conditions are fulfilled:
|
| Measurement | Description | Measurement Unit | Interpretation |
|---|---|---|---|
|
Current Alarms |
Indicates the number of alarms that are currently triggered for this policy. |
Number |
|
|
Recently triggered alarms |
Indicates the number of alarms that were triggered for this policy during the last measurement period. |
Number |
|
|
Info alarms |
Indicates the number of Informational alarms triggered for this policy. |
Number |
|
|
Unknown alarms |
Indicates the number of Unknown alarms triggered for this policy. |
Number |
|
|
Warning alarms |
Indicates the number of Warning alarms triggered for this policy. |
Number |
|
|
Critical alarms |
Indicates the number of Critical alarms triggered for this policy. |
Number |
|
|
Recently triggered info alarms |
Indicates the number of Informational alarms triggered for this policy during the last measurement period. |
Number |
A high value for this measure indicates serious issues in the target environment which needs to resolved at the earliest. |
|
Recently triggered unknown alarms |
Indicates the number of unknown alarms triggered for this policy during the last measurement period. |
Number |
|
|
Recently triggered warning alarms |
Indicates the number of warning alarms triggered during the last measurement period. |
Number |
|
|
Recently triggered critical alarms |
Indicates the number of critical alarms triggered for this policy during the last measurement period. |
Number |
|
Adding /Modifying Policy Filters
The VC alarm policy filter typically comprises of a specific set of alarms, object name, and status to be monitored. This specification is expressed by the eG Enterprise in the following format:
{Policyname}:{alarm_to_be_included}:{alarm_to_be_excluded}:{object_name_to_be_included}:{object_name_to_be_excluded}:{status_to_be_included}:{status_to_be_excluded}
To add a new policy, do the following:
-
Click the
 icon against the VC ALARM FILTER parameter in the test configuration page (see Figure 1).
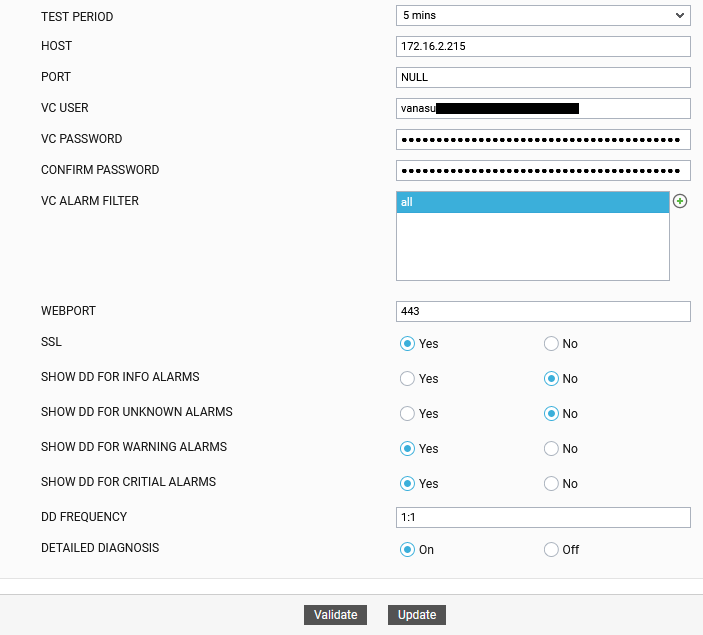
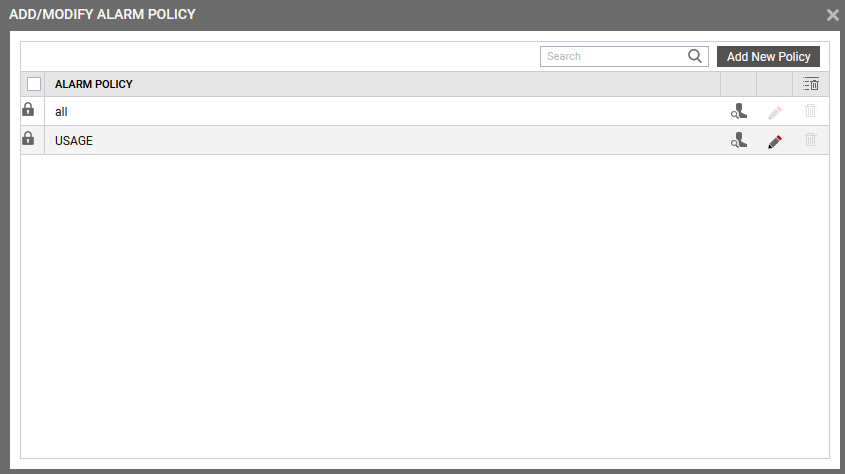
- Figure 2 will then appear listing the policies that pre-exist.
- To view the contents of a policy, click on the
 icon against the policy name. While a policy can be modified by clicking on the
  icon, it can be deleted using the
  icon. The default policy is all, which can only be viewed and not modified or deleted. The specification contained within this policy is: all:none:all:none:Info,Unknown,Warning,Critical:none.
 - To create a new policy, click on the Add New Policy button in Figure 2. Doing so invokes Figure 3, using which a new policy can be created.
- In Figure 3, first, provide a unique name against POLICY NAME.
- To include one/more alarms for monitoring, select Included from the ALARM drop-down list, and then specify a comma-separated list of alarms to be included in the text box under the drop-down list.
-
To exclude specific alarms from monitoring, select Excluded from the ALARM drop-down list, and then specify a comma-separated list of alarms to be excluded in the text box under the drop-down list.
Note:
At any given point in time, you can choose to either Include or Exclude alarms, but you cannot do both. If you have chosen to include alarms, then eG Enterprise automatically assumes that no alarms need be excluded. Accordingly, the {alarms_to_be_excluded} section of the filter format mentioned above, will assume the value none. Similarly, if you have chosen to exclude specific alarms from monitoring, then the {alarms_to_be_included} section of the format above will automatically take the value all, indicating that all alarms except the ones explicitly excluded, will be included for monitoring.
- In the same way, select Included from the Object name list and then, provide a comma-separated list of object names to be included in the text box under the drop-down list.
- If you, on the other hand, want to exclude specific object names from monitoring, then first select Excluded from the OBJECT NAME list box, and then provide a comma-separated list of object names to be excluded in the text box under the drop-down list.
- Likewise, select Included from the Status list and then, provide a comma-separated list of event descriptions to be included in the text box under the drop-down list.
- For excluding specific status from monitoring, first select Excluded from the STATUS list box, and then provide a comma-separated list of status to be excluded in the text box under the drop-down list.
- Finally, click the Update button.
-
The results of the configuration will then be displayed as depicted by Figure 4
-
The newly added policy will then be listed as shown in Figure 5.
-
To add more policies, follow the same process as explained from Step 4 to Step 13.
-
Close the pop up window if you have added the policies. The VC ALARM FILTER parameter in the test configuration page (see Figure 6) will display the newly created policy.
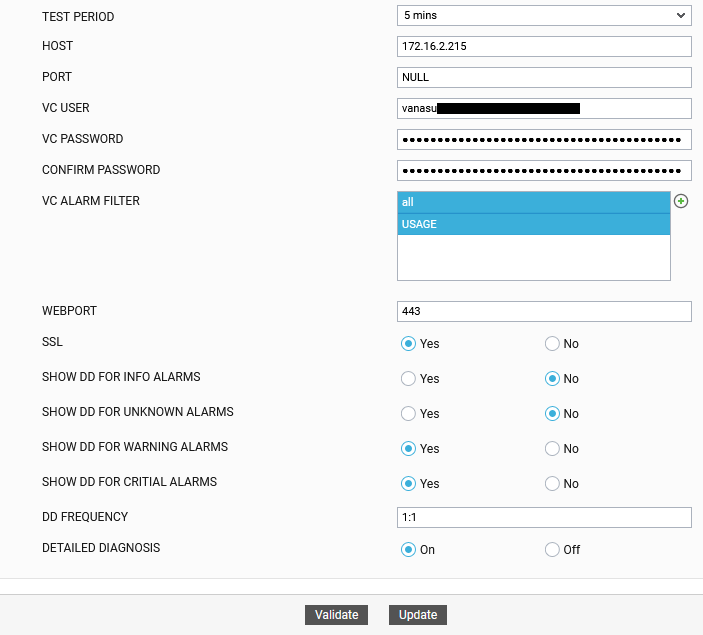
Figure 6 : Viewing the newly added policies against the VC ALARM FILTER parameter
Figure 1 : Test configuration page of vCenter Alarms with Policy test
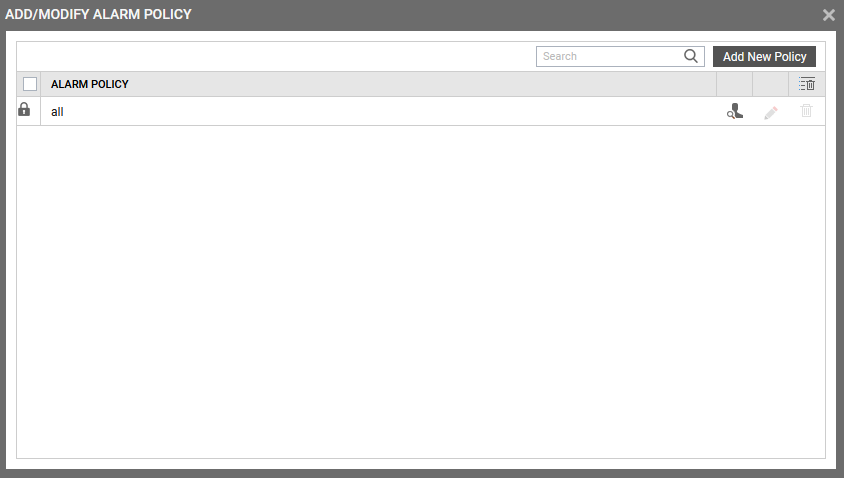
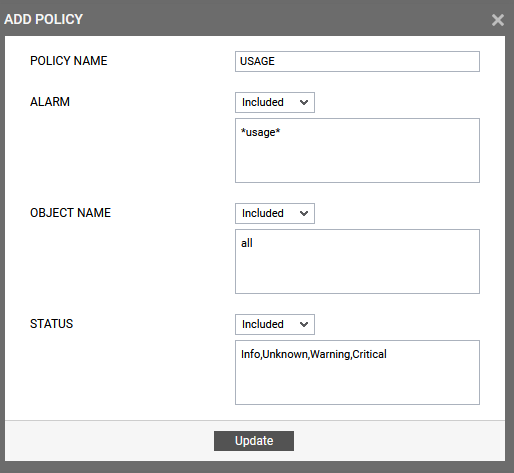
Figure 3 : Adding a new filter policy
Note:
At any given point in time, you can choose to either Include or Exclude object names, but you cannot do both. If you have chosen to include object names, then the eG Enterprise system automatically assumes that no object names need be excluded. Accordingly, the {object_names_to_be_excluded} section of the filter format mentioned above, will assume the value none. Similarly, if you have chosen to exclude specific object names from monitoring, then the {object_names_to_be_included} section of the format above will automatically take the value all, indicating that all object names except the ones explicitly excluded, will be included for monitoring.
Note:
At any given point in time, you can choose to either Include or Exclude status, but you cannot do both. If you have chosen to include status, then the eG Enterprise system automatically assumes that no status need to be excluded. Accordingly, the {status_to_be_excluded} section of the filter format mentioned above, will assume the value none. Similarly, if you have chosen to exclude specific status from monitoring, then the {status_to_be_included} section of the format above will automatically take the value Info,Unknown, Warning, Critical. This indicates that all status except the ones explicitly excluded, will be included for monitoring.