vSAN Overview Test
A VMware vCenter server can manage more than one vSAN cluster. A single vSAN cluster consists of any number of physical server hosts from two to 64. Additional hosts can easily be added to an existing cluster in a matter of minutes for additional compute and storage capacity. vSAN aggregates all local capacity devices into a single datastore shared by all hosts in the vSAN cluster. The datastore can be expanded by adding capacity devices or hosts with capacity devices to the cluster.
To plan the needs of the virtual infrastructure and to determine whether/not additional capacity devices need to be added to the vSAN cluster to handle the current and anticipated load, administrators should keep track on the available resources on the vSAN clusters that are managed by the VMware vCenter server. This can be easily achieved using the vSAN Overview test. This test reports the count of datastores, vSAN clusters and hosts available in the VMware vCenter server.
Note:
This test is applicable only for the vSAN enabled clusters in the VMware vCenter server.
Target of the test : A VMware vCenter server
Agent deploying the test : An internal agent
Outputs of the test : One set of results for VMware vCenter server that is being monitored.
| Parameter | Description |
|---|---|
|
Test Period |
How often should the test be executed. |
|
Host |
The host for which this test is to be configured. |
|
Port |
Refers to the port at which the specified host listens to. |
|
VC User and VC Password |
To connect to vCenter and extract metrics from it, this test should be configured with the name and password of a user with Administrator or Virtual Machine Administrator privileges to vCenter. However, if, owing to security constraints, you are not able to use the credentials of such users for test configuration, then you can configure this test with the credentials of a user with Read-only rights to vCenter. For this purpose, you can assign the ‘Read-only’ role to a local/domain user to vCenter, and then specify name and password of this user against the VC User and VC Password text boxes. The steps for assigning this role to a user on vCenter have been detailed in vCenter servers terminate user sessions based on timeout periods. The default timeout period is 30 mins. When you stop an agent, sessions currently in use by the agent will remain open for this timeout period until vCenter times out the session. If the agent is restarted within the timeout period, it will open a new set of sessions. If you want the eG agent to close already existing sessions on vCenter before it opens new sessions, then, instead of the ‘Read-only’ user, you can optionally configure the VC User and VC Password parameters with the credentials of a user with permissions to View and Stop Sessions on vCenter. For this purpose, you can create a special role on vCenter, grant the View and Stop Sessions privilege (prior to vCenter 4.1, this was called the View and Terminate Sessions privilege) to this role, and then assign the new role to a local/domain user to vCenter. The steps for assigning this role to a user on vCenter have been detailed in |
|
Confirm Password |
Confirm the password by retyping it in this text box. |
|
SSL |
By default, the vCenter server is SSL-enabled. Accordingly, the SSL flag is set to Yes by default. This indicates that the eG agent will communicate with the vCenter server via HTTPS by default. |
|
Webport |
By default, in most virtualized environments, vCenter listens on port 80 (if not SSL-enabeld) or on port 443 (if SSL-enabled) only. This implies that while monitoring vCenter, the eG agent, by default, connects to port 80 or 443, depending upon the SSL-enabled status of vCenter – i.e., if vCenter is not SSL-enabled (i.e., if the SSL flag above is set to No), then the eG agent connects to vCenter using port 80 by default, and if vCenter is SSL-enabled (i.e., if the ssl flag is set to Yes), then the agent-vCenter communication occurs via port 443 by default. Accordingly, the Webport parameter is set to default by default. In some environments however, the default ports 80 or 443 might not apply. In such a case, against the Webport parameter, you can specify the exact port at which vCenter in your environment listens, so that the eG agent communicates with that port for collecting metrics from vCenter. |
|
DD Frequency |
Refers to the frequency with which detailed diagnosis measures are to be generated for this test. The default is 1:1. This indicates that, by default, detailed measures will be generated every time this test runs, and also every time the test detects a problem. You can modify this frequency, if you so desire. Also, if you intend to disable the detailed diagnosis capability for this test, you can do so by specifying none against DD frequency. |
|
Detailed Diagnosis |
To make diagnosis more efficient and accurate, the eG Enterprise embeds an optional detailed diagnostic capability. With this capability, the eG agents can be configured to run detailed, more elaborate tests as and when specific problems are detected. To enable the detailed diagnosis capability of this test for a particular server, choose the On option. To disable the capability, click on the Off option. The option to selectively enable/disable the detailed diagnosis capability will be available only if the following conditions are fulfilled:
|
| Measurement | Description | Measurement Unit | Interpretation |
|---|---|---|---|
|
No of datastores |
Indicates the total number of datastores in the target VMware vCenter. |
Number |
The detailed diagnosis of this measure reveals the name of each datastore and the name of datacenter to which the datastore belongs to. |
|
No of clusters |
Indicates the total number of vSAN cluster in the target VMware vCenter. |
Number |
The detailed diagnosis of this measure reveals the name of each cluster and the name of datacenter to which the cluster belongs to. |
|
No of hosts |
Indicates the total number of hosts in the target VMware vCenter. |
Number |
The detailed diagnosis of this measure reveals the name of each host and the name of cluster to which the host belongs to. |
The detailed diagnosis of the No of datastores measure lists the datastores and the datacenters to which the datastores belong to.
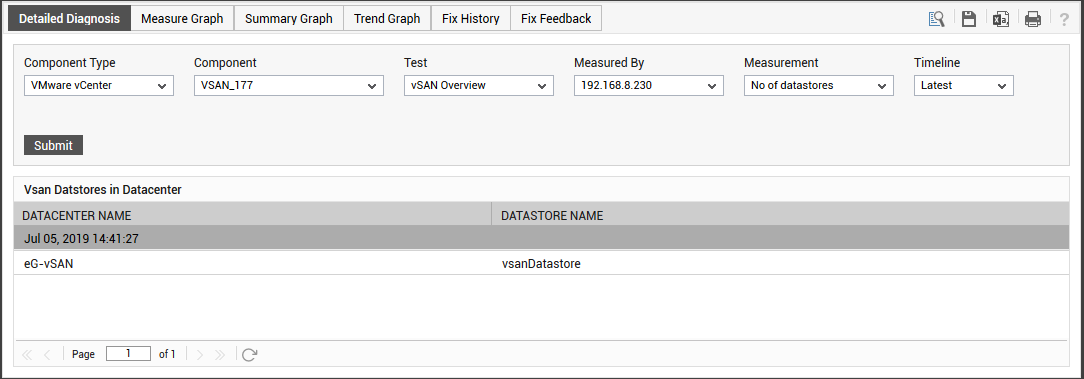
Figure 1 : The detailed diagnosis of the No of datastores measure
The detailed diagnosis of the No of clusters measure lists the clusters and the datacenters to which the clusters belong to.
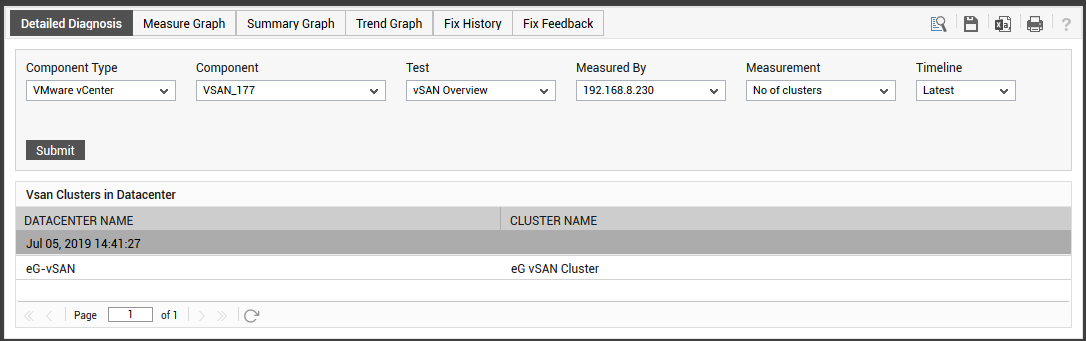
Figure 2 : The detailed diagnosis of the No of clusters measure
The detailed diagnosis of the No of hosts measure lists the hosts and the clusters to which the hosts belong to.
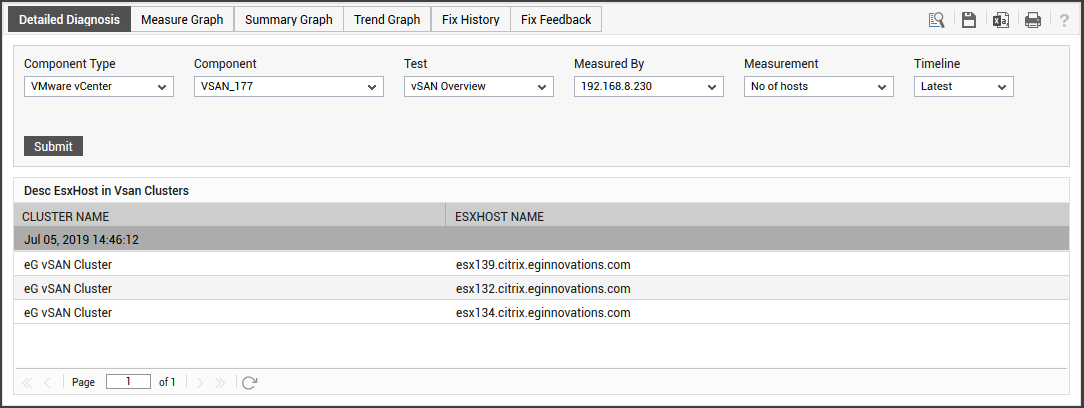
Figure 3 : The detailed diagnosis of the No of hosts measure