Browser Activity – OS Test
When a user complains of a cloud PC slowdown, administrators will have to instantly figure out if that VM is experiencing a resource crunch, and if so, which process/application on the PC is contributing
to it. One of the common reasons for CPU/memory contentions and handle leaks on a PC is web browsing! If a user to a PC browses resource-intensive web sites, it is bound to result in over-usage of the resources allocated to that PC, which in turn degrades the performance of not just that PC but even the other PCs on that host. While the System Details – OS test can lead administrators to the exact browser application that is consuming the CPU/memory resources of the PC excessively, it does not provide visibility into the precise websites that were been browsed when the resource contention occurred. This is where the Browser Activity – OS test helps.
For each web browser that is being accessed by a user per cloud PC, this test reports how every browser uses the allocated CPU, memory, and disk resources and reveals the number and URLs of the web sites that are being accessed using each browser. This way, the test not only points administrators to resource-hungry browsers, but also indicates which web sites were being accessed using that browser.
Target of the test : A Windows 365 Cloud PCs Group
Agent deploying the test : A remote agent
Outputs of the test : One set of results for each browser used by every user logged into every cloud PC
| Parameter | Description |
|---|---|
|
Test Period |
How often should the test be executed. |
|
Host |
The nick name of the Windows 365 Cloud PCs Group component for which this test is to be configured. |
|
Port |
Refers to the port at which the specified host listens to. By default, this is NULL. |
|
Report Powered OS |
If this flag is set to Yes (which is the default setting), then the 'inside view' tests will report measures for even those Cloud PCs that do not have any users logged in currently. Such cloud PCs will be identified by their name and not by the username_on_CloudPCName. On the other hand, if this flag is set to No, then this test will not report measures for those cloud PCs to which no users are logged in currently. |
|
Report By User |
This flag is set to Yes by default. The value of this flag cannot be changed. This implies that the cloud PCs in environments will always be identified using the login name of the user. In other words, this test will, by default, report measures for every username_on_CloudPCName. |
|
Show Recent Website DD |
Typically, the detailed diagnosis of the Recent websites measure, if enabled, reveals the URL that is open in each browser tab of a cloud PC. In large cloud-based environments supporting hundreds of PCs and users on the cloud, collecting and storing the details of every browser tab that a user opens can increase the strain on the eG database. To avoid this, by default, this test does not collect detailed diagnostics for the Recent websites measure. Accordingly, the this flag is set to No by default. You can turn this flag on if you want, by selecting the Yes option. If this is done, then this test will collect detailed metrics for the Recent websites measure. |
|
DD Frequency |
Refers to the frequency with which detailed diagnosis measures are to be generated for this test. The default is 1:1. This indicates that, by default, detailed measures will be generated every time this test runs, and also every time the test detects a problem. You can modify this frequency, if you so desire. Also, if you intend to disable the detailed diagnosis capability for this test, you can do so by specifying none against DD frequency. |
|
Detailed Diagnosis |
To make diagnosis more efficient and accurate, the eG suite embeds an optional detailed diagnostic capability. With this capability, the eG agents can be configured to run detailed, more elaborate tests as and when specific problems are detected. To enable the detailed diagnosis capability of this test for a particular server, choose the On option. To disable the capability, click on the Off option. The option to selectively enable/disable the detailed diagnosis capability will be available only if the following conditions are fulfilled:
|
| Measurement | Description | Measurement Unit | Interpretation |
|---|---|---|---|
|
Running browser instances |
Indicates the number of instances of this browser currently running on this PC. |
Number |
Use the detailed diagnosis of this measure to know how much resources were utilized by each instance of a browser, so that the resource-hungry instance can be isolated. |
|
Recent web sites |
Indicates the number of websites that were accessed using this browser on this PC during the last measurement period. |
Number |
Use the detailed diagnosis of this measure to know which web sites are being accessed using a browser. |
|
CPU utilization |
Indicates the percentage CPU usage of this browser on this PC. |
Percent |
Compare the value of this measure across browsers to know which browser consumed the maximum CPU on a desktop. If the value of this measure is close to 100% on that desktop, it indicates excessive CPU usage by the browser. You may then want to use the detailed diagnosis of the Recent web sites measure to know which web sites are being accessed using that browser, which caused CPU usage to soar. |
|
Memory used |
Indicates the percent usage of memory by this browser on this PC. |
Percent |
Compare the value of this measure across browsers to know which browser consumed the maximum memory on a desktop. If the value of this measure is close to 100% on that desktop, it indicates excessive memory usage by the browser. You may then want to use the detailed diagnosis of the Recent web sites measure to know which web sites are being accessed using that browser, which caused CPU usage to soar. |
|
Handles used |
Indicates the number of handles opened by this browser on this PC. |
Number |
Compare the value of this measure across browsers to know which browser opened the maximum number of handles on a desktop. If the value of this measure consistently increases on that desktop, it indicates that the corresponding browser is leaking memory. You may then want to use the detailed diagnosis of the Recent web sites measure to know which web sites are being accessed using that browser, which caused the memory leak. |
|
Disk reads |
Indicates the rate at which this browser read from the disks supported by this PC. |
KB/Sec |
A high value for these measures indicates that the browser is generating high disk I/O. You may then want to use the detailed diagnosis of the Recent web sites measure of this browser to know which web sites on the browser are responsible for the high disk I/O. |
|
Disk writes |
Indicates the rate at which this browser read from the disks of this PC. |
KB/Sec |
|
|
Disk IOPS |
Indicates the rate of read and write operations performed by this browser on the disks of this PC. |
Operations/Sec |
A high value for this measure indicates that the browser is generating high disk I/O. You may then want to use the detailed diagnosis of the Recent web sites measure of this browser to know which web sites on the browser are responsible for the high disk I/O. |
|
Page faults |
Indicates the rate at which page faults by the threads executing in this browser are occurring on this PC. |
Faults/Sec |
Ideally, the value of this measure should be low. A high value for a browser is a cause for concern. You may then want to use the detailed diagnosis of the Recent web sites measure of this browser to know which web sites on the browser are responsible for page faults. |
The detailed diagnosis of the Running browser instances measure reveals the process ID of each browser instance that is currently running on the PC and the resource usage of each instance. This way, you can easily and accurately identify the instance that is consuming resources excessively.
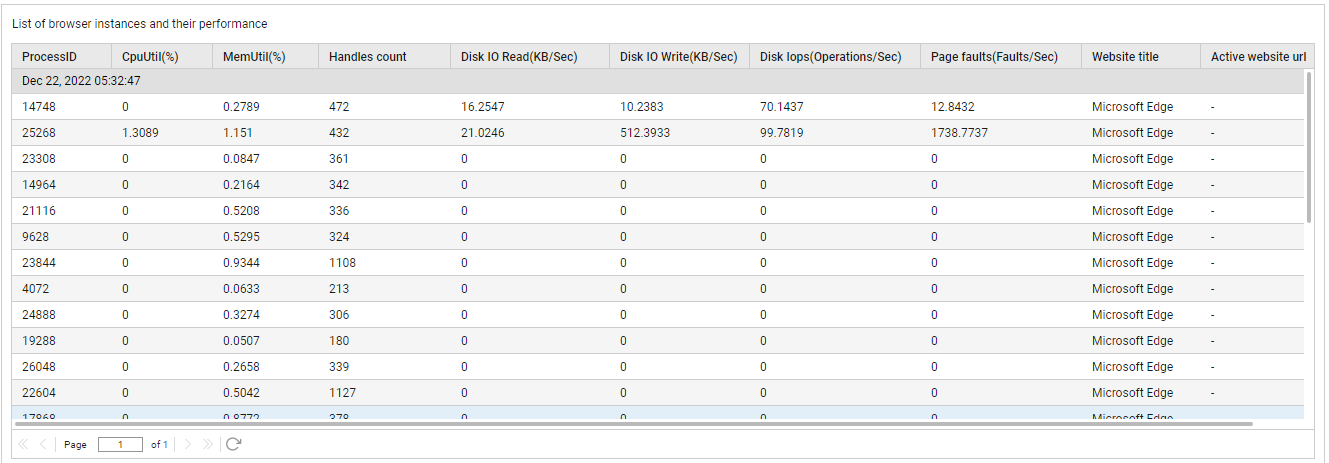
Figure 1 : The detailed diagnosis of the Running browser instances measure
The detailed diagnosis of the Recent web sites measure reveals the names and URLs of the web sites that are being accessed using a browser.
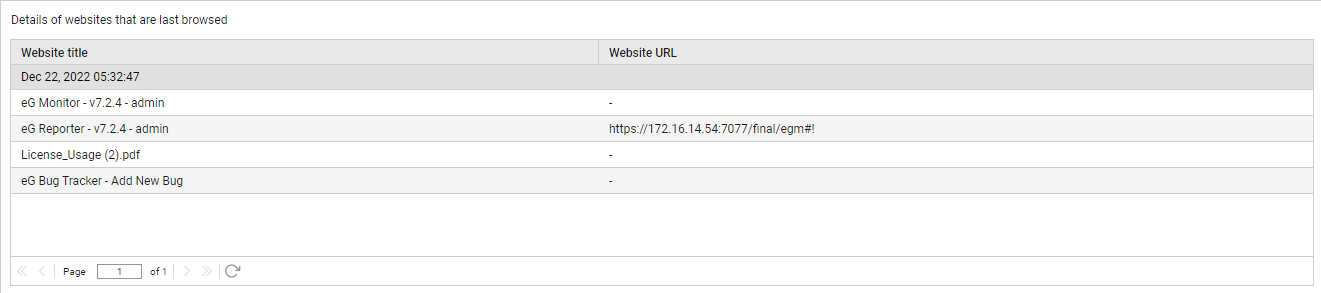
Figure 2 : The detailed diagnosis of the Recent web sites measure