Meeting Events Test
Zoom offers various different ways to communicate including calls, meetings, webinars etc. Zoom meetings are most used function of the Zoom and is a great way to connect with people. To ensure that meeting experience for people is smooth, it is important to monitor the events emitted by Zoom during the meeting. By capturing the events and analyzing the event data, administrators can get insights about the performance of the meeting.
This test monitors the meetings for various events and collects metrics around flow events, live streaming events etc.
With the help of the detailed diagnostics of this test, you can also identify which add-on was most commonly used by the users.
Target of the test : Zoom
Agent deploying the test : A remote agent
Outputs of the test : One set of results for the zoom account
| Parameters | Description |
|---|---|
|
Test period |
How often should the test be executed, the default value is 12 hrs. |
|
Host |
The host for which the test is to be configured. By default, this is Zoom.us. |
|
Client ID |
When configuring the Zoom API, you should have created an API client with OAuth authentication. Each client app is assigned with a Client ID which you need to copy from client app configuration wizard and save down. Zoom API requires Client ID and Secret Token when calling REST APIs. To know more about how to create Client ID and Secret Token, refer to Setting up Zoom API |
|
Secret Token |
Secret Token is created along with Client ID during API configuration. Each client app is assigned with a Client ID which you need to copy from client app configuration wizard. Zoom API requires Client ID and Secret Token when calling REST APIs. To know more about how to create Client ID and Client Secret, refer to Setting up Zoom API |
|
Show N DD |
By default, this parameter is set to 50. This indicates that, by default, the detailed diagnosis of this test will display the details of only 50 events. If you wish this test to report details of all events, then specify "all" against this parameter. |
|
DD Frequency |
Refers to the frequency with which detailed diagnosis measures are to be generated for this test. The default is 1:1. This indicates that, by default, detailed measures will be generated every time the test runs, and also every time the test detects a problem. You can modify this frequency, if you so desire. Also, if you intend to disable the detailed diagnosis capability for this test, you can do so by specifying none against DD Frequency. |
|
Detailed Diagnosis |
To make diagnosis more efficient and accurate, the eG Enterprise embeds an optional detailed diagnostic capability. With this capability, the eG agents can be configured to run detailed, more elaborate tests as and when specific problems are detected. To enable the detailed diagnosis capability of this test for a particular server, choose the On option. To disable the capability, click on the Off option. The option to selectively enabled/disable the detailed diagnosis capability will be available only if the following conditions are fulfilled:
|
| Measurement | Description | Measurement Unit | Interpretation |
|---|---|---|---|
|
Meeting flow events |
Indicates the number of events registered during the operation of the meeting. |
Number |
Events like meeting started, meeting ended etc.are received every time somethings happens in the meeting. The detailed diagnosis of this measure lists the name of the time of the event, type, start time, end time, timezone, duration, join url, host id, operator, operation, meeting id and meeting UUID. |
|
Meeting registrant events |
Indicates the number of events whenever a new meeting registration is created. |
Number |
The detailed diagnosis of this measure lists the name of the time of the event, type, start time, end time, timezone, duration, join url, host id, operator, operation, meeting id and meeting UUID. |
|
Meeting live streaming events |
Indicates the number of events related to live streaming. |
Number |
The detailed diagnosis of this measure lists the name of the time of the event, type, start time, end time, timezone, duration, join url, host id, operator, operation, meeting id and meeting UUID. |
|
Meeting device tested events |
Indicates the number of events related to targed devices being tested. |
Number |
The detailed diagnosis of this measure lists the name of the time of the event, type, start time, end time, timezone, duration, join url, host id, operator, operation, meeting id and meeting UUID. |
|
Meeting issues alert events |
Indicates the number of events related to issuing of alters to the users. |
Number |
The detailed diagnosis of this measure lists the name of the time of the event, type, start time, end time, timezone, duration, join url, host id, operator, operation, meeting id and meeting UUID. |
|
At risks meeting notifier events |
Indicates the number of events related to notification being issued. |
Number |
The detailed diagnosis of this measure lists the name of the time of the event, type, start time, end time, timezone, duration, join url, host id, operator, operation, meeting id and meeting UUID. |
The detailed diagnosis of the Meeting Flow events measure lists the events, event time, topic, type, start time, timezone, duration, registration details, host id, operator, meeting id, meeting UUID:
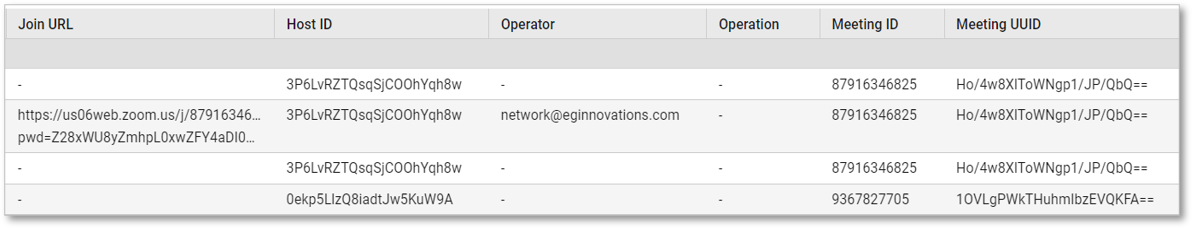
Figure 1 : The detailed diagnosis of the Meeting Flow event measure
The detailed diagnosis of the Meeting Registration events measure lists the events, event time, topic, type, start time, timezone, duration, registration details, host id, operator, meeting id, meeting UUID:

Figure 2 : The detailed diagnosis of the Meeting Registration Event
The detailed diagnosis of the Live Streaming events measure lists the events, event time, topic, type, start time, timezone, duration, registration details, host id, operator, meeting id, meeting UUID:
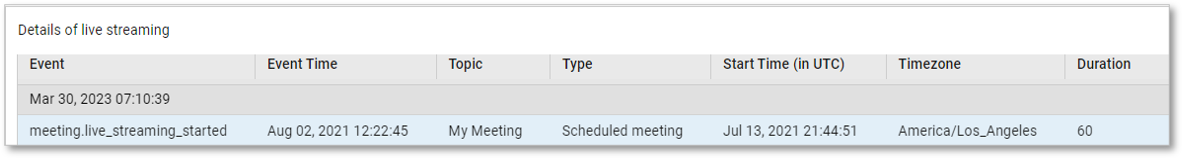

Figure 3 : The detailed diagnosis of the Live Streaming events
The detailed diagnosis of the Meeting Device Tested events measure lists the events, event time, topic, type, start time, timezone, duration, registration details, host id, operator, meeting id, meeting UUID:


Figure 4 : The detailed diagnosis of the Meeting Device Tested events
The detailed diagnosis of the Risk Meeting Notifier events measure lists the events, event time, topic, type, start time, timezone, duration, registration details, host id, operator, meeting id, meeting UUID:

Figure 5 : The detailed diagnosis of the Risk Meeting Notifier events