Monitoring webMethods Microservices Runtime
eG Enterprise provides a specialized monitoring model for webMethods Microservices Runtime.
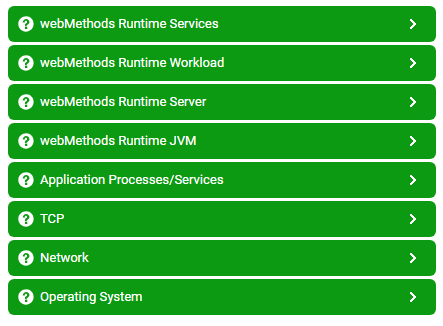
Figure 1 : Layer model of webMethods Microservices Runtime
Every layer in the Figure 1 is mapped to various tests to determine the critical statistics related to the performance of the target webMethods Microservices Runtime server. Using the metrics reported by the tests, administrators can find accurate answers for the following performance queries:
-
Is the health of the component in the target server down?
-
Is the count of freed objects during garbage collection high?
-
Were many active threads identified, causing resource contention, such as CPU or memory strain?
-
Were user sessions in webMethods Microservices Runtime server able to manage and track active interactions with the server?
-
Was any CPU contention noticed on the webMethods Microservices Runtime server? What caused this contention – resource-hungry user processes?
-
Is there sufficient disk space in webMethods Microservices Runtime server?
-
Is there a garbage collection bottleneck?
-
Has the JVM been up and running continuously?
-
Does the JVM have sufficient free memory?
Since the Operating System and TCP layers have been elaborately discussed in Monitoring Unix and Windows Servers document, the tests mapped to the Network layer have been elaborately discussed in Monitoring Cisco Router document, the sections to come will discuss the other layers in detail.