JMX monitoring for improved Java application performance
Easily monitor JVMs and Java web application servers with the eG Enterprise JMX performance monitoring solution. Improve the performance of your applications by identifying bottlenecks at the code-level and in the infrastructure.
Free TrialWhat is JMX?
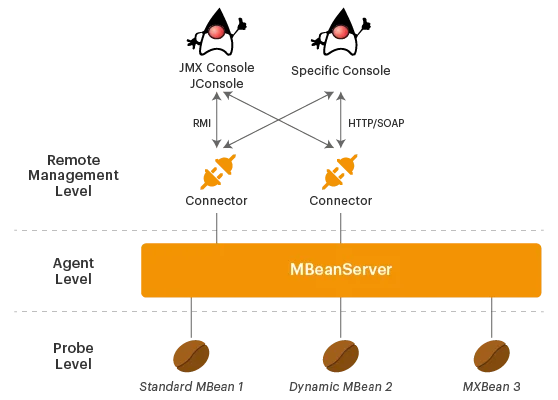
Java Management Extensions (JMX) is a Java technology that includes tools for managing and monitoring applications, system objects and service-oriented networks. Those resources are represented by objects called MBeans (Managed Beans). JMX monitoring tools use a three-level architecture:
- The Probe level contains the probes (called MBeans) that represent different attributes about the resources being monitored.
- The Agent level, or MBeanServer - exposes the MBeans to applications.
- The Remote Management level enables remote applications to access the MBeanServer through connectors and adaptors. A connector provides full remote access to the MBeanServer API using various communication (RMI, IIOP, JMS, WS-* ).
What is JMX Monitoring?
– Importance and Uses
JMX is to Java applications what SNMP is to network devices. Therefore, JMX is a very important mechanism that is widely used by monitoring and management tools to collect performance metrics about the applications. JMX can be used in multiple ways:
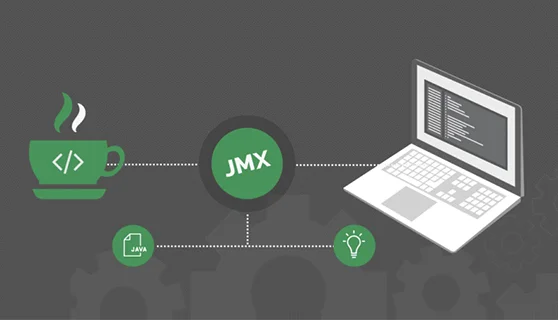
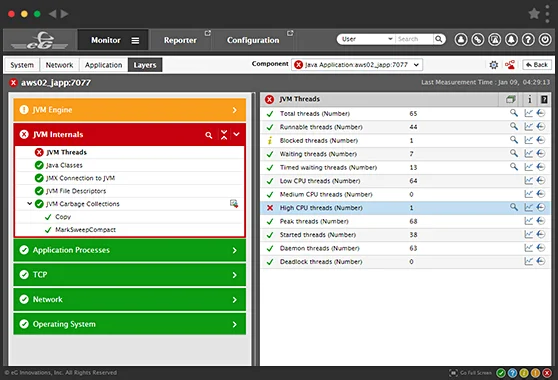
- Monitoring of the JVMs running on a server is done using JMX. eG agents connect to standard MBeans exposed by the JVM to collect key performance metrics including threads running in the JVM, when garbage collection happens, how much memory is released during garbage collection and so on.
- Standard Java application servers such as Tomcat, JBoss, WebLogic, etc. expose performance metrics through JMX. JMX interfaces facilitate both agent and agentless monitoring of these application servers.
- Custom MBeans exposed by applications running on these application servers can be monitored.
eG Enterprise for JMX monitoring
eG Enterprise allows application and IT operations teams to monitor Java applications without needing to write any code.
- Monitor all aspects of JVM performance using built-in Jave JMX monitoring capabilities
- Use JMX to monitor web container performance and identify bottlenecks
- Monitor custom Java applications using JMX technology
- Auto-baseline and alert when abnormalities are noticed with values of custom MBeans configured by the IT admins
Since we don't control everything between our data center and client locations, events occasionally occur where service availability or application performance issues arise. eG Enterprise helps us pinpoint the nature and origin of the problem right away so we can resume normal operations as quickly as possible.![]()
Java JMX Observability (Monitoring) with
eG Enterprise
eG Enterprise supports agent-based and agentless monitoring of Java applications using JMX. Its Java JMX performance monitoring capabilities include:
- Monitoring of user experience through synthetic and real user monitoring
- Monitoring of all aspects of Java virtual machine performance including active and blocked threads, CPU usage, memory analysis, garbage collection activity and more
- Monitoring of the web containers to identify any configuration bottlenecks
- Monitoring of custom applications including code-level visibility
JMX is a key technology enabling several of these capabilities.
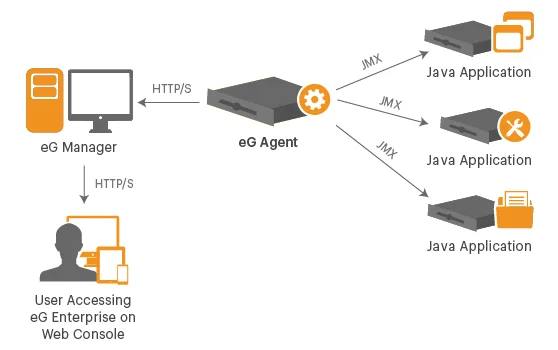
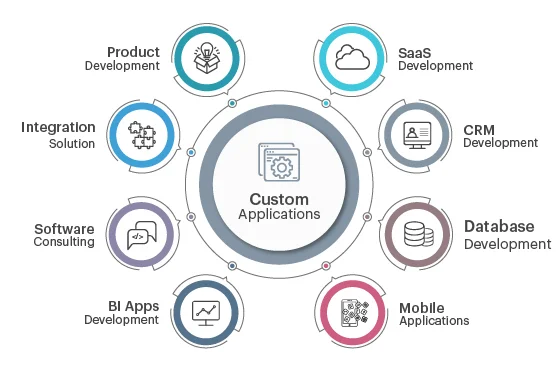
Monitoring custom Java applications with JMX technology
Many application developers use Java JMX metrics to expose performance insights of their custom applications. eG Enterprise allows application and IT operations teams to monitor these custom applications without needing to write any code. With eG Enterprise, you can:
