Monitor your entire Tomcat application stack within a single-pane-of-glass and get visibility into the performance of your JVM, web and EJB containers, application code, database connections, slow queries, external service calls, and more.
Free TrialTrusted by leading companies

The Tomcat application server is one of the more popular server implementations for Java web applications. Implementing a "pure Java" HTTP web server, Apache Tomcat supports Java Servlets, Java Server Pages, and WebSockets, thereby making it a favorite choice for deploying and hosting highly transactional Java applications and services.
To ensure high application performance, it is essential to monitor the Tomcat application server, the Java Virtual Machine (JVM) it uses, the application components it hosts, and the infrastructure tiers supporting it. IT teams and developers need the capability to proactively detect performance problems before they impact end-users of the Java application.

eG Enterprise is a full-stack application performance monitoring that delivers in-depth insights into Java applications powered by Tomcat. From an intuitive web console, application owners, developers, and administrators can:

eG Enterprise helps you enhance the performance of your Tomcat applications:
Get comprehensive view of all Tomcat performance metrics in one place

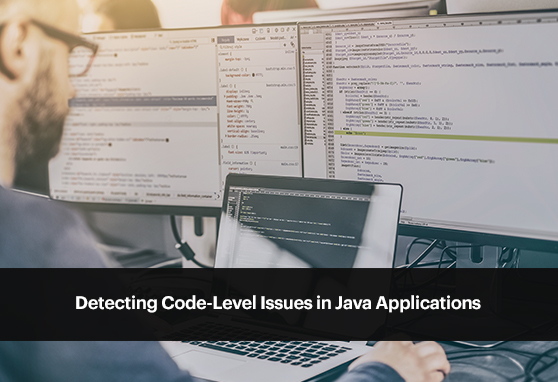
eG Enterprise allows developers to easily identify Java code-level issues.


eG Enterprise delivers total performance assurance for web applications powered by Java technology:

Apache Tomcat is an open-source web server and servlet container that implements the Java Servlet, Java Server Pages (JSP), and WebSocket technologies. It is widely used to deploy Java-based web applications.
The key components of the Tomcat architecture include:
Monitoring Apache Tomcat is essential to ensure the optimal performance and availability of Java web applications. By monitoring Tomcat, IT teams can detect and resolve performance issues, identify potential bottlenecks, ensure resource utilization is within limits, and maintain high availability and user satisfaction.
Monitoring of Apache Tomcat should be done at different levels:
By monitoring at all these levels, you will have the best chance of diagnosing performance issues quickly, when users complain that “the Java application is slow”.
IT operations, Site Reliability Engineers (SREs) and DevOps teams can benefit from Apache Tomcat monitoring. They can get real-time alerts on performance issues, automated root cause analysis, deep visibility to quickly diagnose where the problems lie: is it the JVM, or the Tomcat container, the workload, the database, or an issue in the application code or its external dependencies?
Common performance issues you may encounter when supporting Apache Tomcat include high CPU usage, memory leaks, thread contention, slow request processing, database connectivity issues, and application errors. eG Enterprise monitors these performance metrics in real-time, provides historical trends, and offers automated diagnostics to troubleshoot and resolve such issues proactively.
Firstly, full stack monitoring is required. This includes monitoring the JVM, the Tomcat container, server logs and application transactions. Metrics from these different sources must be aggregated and presented in easy-to-understand visual dashboards. At the same time, detailed drilldowns must be provided. For example, if Tomcat’s CPU usage is high, you will need to be able to quickly drill down and see which thread in the JVM is causing the CPU spike. Historical reporting to be able to trace back in time is another key requirement.
Check out our blog on the top 7 metrics to monitor for Apache Tomcat: https://www.eginnovations.com/blog/tomcat-monitoring-metrics/
Monitoring a Tomcat web application server can provide insights that can be used to tune an Apache Tomcat web application server. For example, if the Java heap size is set too low, increase the Xmx value used for Tomcat’s JVM. There are also configuration settings that can be tuned to increase performance. Read our blog on this topic: https://www.eginnovations.com/blog/tomcat-performance-tuning/
Yes, there are differences as outlined below: