IT Performance Monitoring Insights
Get tips, tricks and best practices for IT troubleshooting,
performance tuning and optimizations


What is Windows Event Log?
Learn how to integrate Window Event Log events into your proactive monitoring strategy, including how to leverage custom event logs and how to use live and historical reporting to get comprehensive long-term observability.

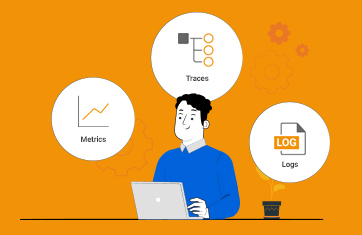
The Three Pillars of Observability: Metrics, Logs and Traces
Metrics, Logs and Traces are the three essential data types that make up the “Three Pillars of Observability”. Understand the advantages and disadvantages of each data type and why it is important to look beyond the three pillars for complete end-to-end full stack visibility.


Monitoring vs Observability:
What is the Difference?
What is observability? Is observability the same thing as monitoring? We discuss the difference and how eG Enterprise helps with observability solutions.


End-to-End Application Monitoring Helps Troubleshoot Application Slowness
A real-world example of application performance troubleshooting a Java web app, hosted on JBoss Wildfly using Microsoft SQL as the backend database; including details of the analysis and diagnosis performed to identify the root-cause of the performance issue.

Case Study: AWS Cloud Application Performance Troubleshooting
In this blog post, we describe a problem analysis and anomaly detection process for a cloud performance problem that our enterprise customer successfully resolved using full stack observability (metrics, events, logs, and traces).