Controllers Test
Controllers are server machines running instances of the broker service. This test auto-discovers the delivery controllers configured within a site, and reports the current status of each controller and the count of machines registered with every controller.
Target of the test : A controller in a Citrix Virtual Apps/Desktops Site 7.x
Agent deploying the test : An internal agent
Outputs of the test : One set of results for the XenDesktop server site to which the target controller belongs.
| Parameter | Description |
|---|---|
|
Test Period |
How often should the test be executed |
|
Host |
The IP address of the host for which the test is being configured. |
|
Port |
The port number at which the specified Host listens to. By default, this is 80. |
|
Domain, Username |
To connect to a delivery controller in a site and pull out metrics from it, this test should be configured with the following:
|
|
Confirm Password |
Confirm the Password by retyping it here. |
|
Detailed Diagnosis |
To make diagnosis more efficient and accurate, the eG Enterprise embeds an optional detailed diagnostic capability. With this capability, the eG agents can be configured to run detailed, more elaborate tests as and when specific problems are detected. To enable the detailed diagnosis capability of this test for a particular server, choose the On option. To disable the capability, click on the Off option. The option to selectively enable/disable the detailed diagnosis capability will be available only if the following conditions are fulfilled:
|
| Measurement | Description | Measurement Unit | Interpretation | ||||||||||
|---|---|---|---|---|---|---|---|---|---|---|---|---|---|
|
Controller state |
Indicates the current state of this desktop delivery controller. |
Number |
This test reports one of the following values to indicate the current state of a desktop delivery controller:
The numeric values that correspond to the above-mentioned states are as follows:
Note: By default, this measure reports the above-mentioned States while indicating the current state of a controller. However, the graph of this measure will represent states using the corresponding numeric equivalents – i.e., 1 to 4. The detailed diagnosis of this measure reveals when the controller was last accessed, when it was last started, the zone to which the controller belongs, and also displays the site services that were active on the controller during its last access. |
||||||||||
|
Total registered machines |
Indicates the number of machines that are currently registered with this controller. |
Number |
|
The detailed diagnosis of the Controller state measure reveals when the controller was last accessed, when it was last started, the zone to which the controller belongs, and also displays the name of the machine on which the controller is installed, the version of the controller, the Operating system of the machine and the Operating system version.
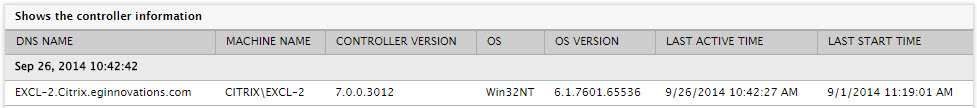
Figure 1 : The detailed diagnosis of the Controller state measure