How does eG Enterprise Monitor Gigamon Traffic Node?
eG Enterprise monitors the Gigamon Traffic Node using an eG external agent that is deployed on any remote host in the environment and configure that agent to periodically poll the SNMP MIB of the target traffic node to pull out metrics of interest. To monitor the target node, you need to make sure that the traffic node is SNMP-enabled.
To start monitoring the Gigamon Traffic Node, first, add the Gigamon Traffic Node component using the admin interface. The steps for doing this are explained in the following section.
Adding the Gigamon Traffic Node
To add a Gigamon Traffic Node component for monitoring, do the following:
-
Log into the eG administrative interface.
-
Click on the Add Component button in the right corner of the Components at a Glance page that appeared or follow the Infrastructure -> Components -> Add/Modify menu sequence.
-
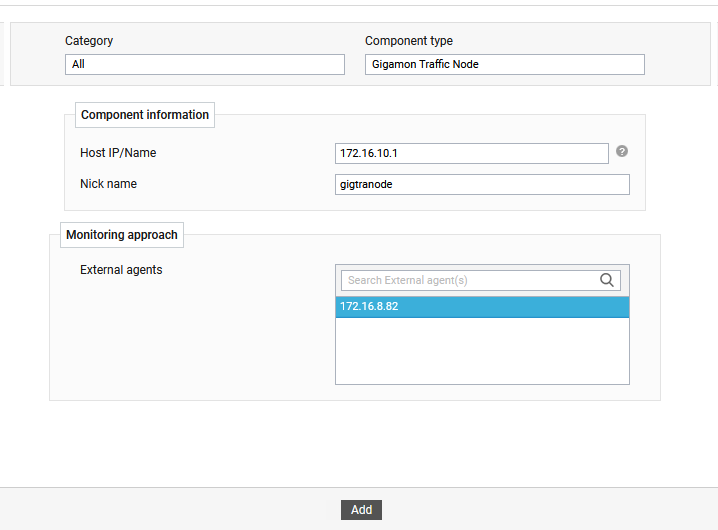
In the COMPONENT page that appears next, select Gigamon Traffic Node as the Component type. Then, click the Add New Component button.
-
Specify the Host IP/Name and the Nick name of the Gigamon Traffic Node as shown in Figure 1, and click the Add button to register the changes.
-
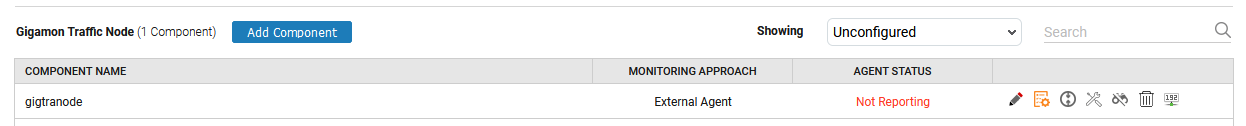
Once the traffic node is added successfully, you will be again redirected to the Components Add/Modify page (see Figure 1). Using the options provided in the Components Add/Modify page, you can modify, unmanage or delete the newly added component. In addition, you can also configure the tests.
-
Click on any test in the list of unconfigured tests (see Figure 3).
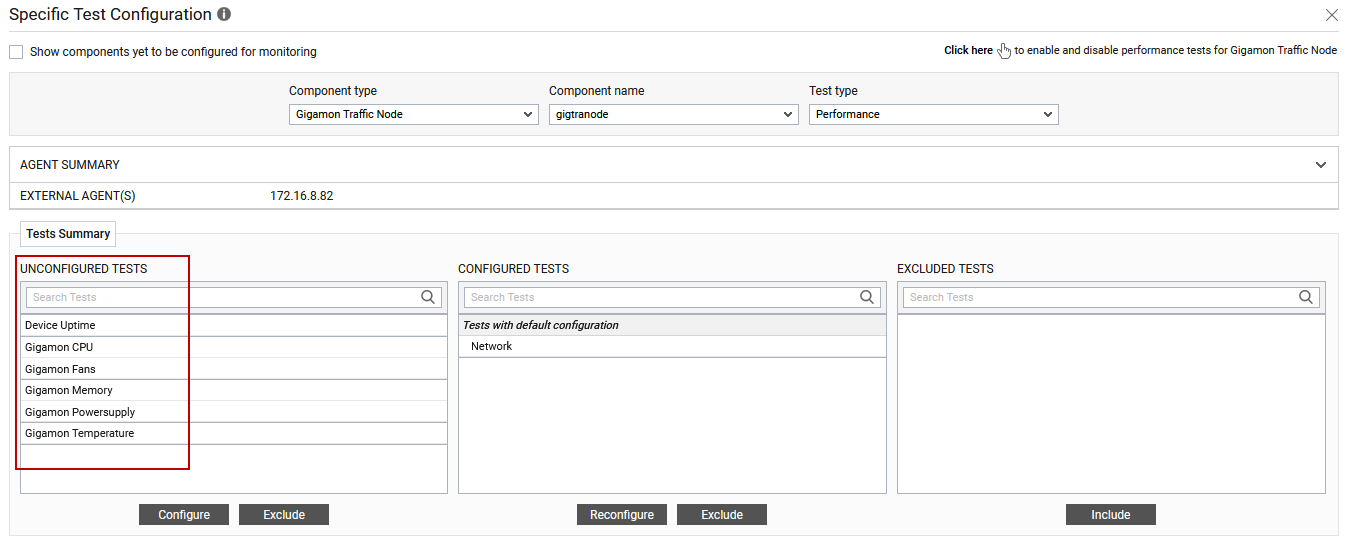
Figure 3 : List of unconfigured tests for Gigamon Traffic Node
To know how to configure the tests, refer Monitoring Gigamon Traffic Node. Once the tests are configured, switch to the Monitor tab to view the metrics reported by the configured tests.