Hadoop Jobs Queues Test
Apache YARN (Yet Another Resource Negotiator) is Hadoop’s cluster resource management system.
YARN provides its core services via two types of long-running daemon: a resource manager (one per cluster) to manage the use of resources across the cluster, and node managers running on all the nodes in the cluster to launch and monitor containers. A container executes an application-specific process with a constrained set of resources (memory, CPU, and so on). Figure 1 illustrates how YARN runs an application.
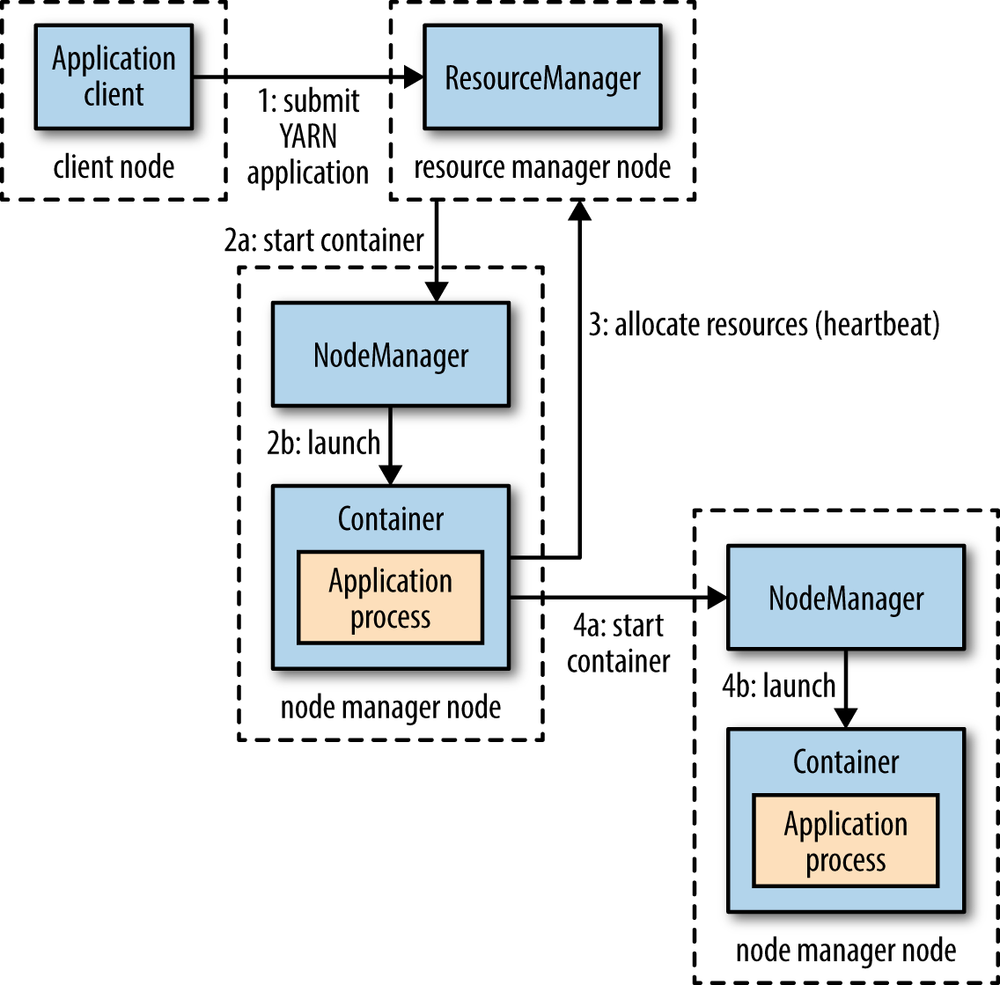
Figure 1 : How YARN runs an application
To run an application on YARN, a client contacts the resource manager and asks it to run an application master process (step 1 in Figure 1). The resource manager is the master daemon of YARN and is responsible for resource assignment and management among all the applications. Whenever it receives a processing request, it forwards it to the corresponding node manager and allocates resources for the completion of the request accordingly. The node manager launches the application master in a container (steps 2a and 2b). Precisely what the application master does once it is running depends on the application. It could simply run a computation in the container it is running in and return the result to the client. Or it could request more containers from the resource managers (step 3), and use them to run a distributed computation (steps 4a and 4b).
In an ideal world, the requests that a YARN application makes would be granted immediately. In the real world, however, resources are limited, and on a busy cluster, an application will often need to wait to have some of its requests fulfilled. The Scheduler component of the resource manager manages resource allocations to applications. Typically, the scheduler places applications in queues and allocates resources to them based on pre-defined policies.
The true test of the efficiency of the scheduler lies in how quickly it makes resources available to the applications/jobs in queues. Delay in resource allocation is one of the common causes for application jobs to fail or remain pending in the queues for a long time. By tracking the status of jobs in queues, an administrator can proactively detect potential application slowness. This is where the Hadoop Jobs Queues test helps!
This test auto-discovers the queues spawned by the YARN scheduler, and for each queue, reports the count of jobs that are in different states of activity. In the process, the test points administrators to those queues that have one/more failed jobs, long-running jobs, and those with jobs that have not been assigned a container yet. This way, administrators can be proactively alerted to potential issues in resource allocations by the scheduler.
Target of the test : A Hadoop cluster
Agent deploying the test : A remote agent
Outputs of the test : One set of the results for each queue spawned by the scheduler component of the resource manager of the target Hadoop cluster
| Parameter | Description |
|---|---|
|
Test Period |
How often should the test be executed. |
|
Host |
The IP address of the NameNode that processes client connections to the cluster. NameNode is the master node in the Apache Hadoop HDFS Architecture that maintains and manages the blocks present on the DataNodes (slave nodes). NameNode is a very highly available server that manages the File System Namespace and controls access to files by clients. |
|
Port |
The port at which the NameNode accepts client connections. NameNode is the master node in the Apache Hadoop HDFS Architecture that maintains and manages the blocks present on the DataNodes (slave nodes). NameNode is a very highly available server that manages the File System Namespace and controls access to files by clients. By default, the NameNode's client connection port is 8020. |
|
Name Node Web Port |
The eG agent collects metrics using Hadoop's WebHDFS REST API. While some of these API calls pull metrics from the NameNode, some others get metrics from the resource manager. NameNode is the master node in the Apache Hadoop HDFS Architecture that maintains and manages the blocks present on the DataNodes (slave nodes). NameNode is a very highly available server that manages the File System Namespace and controls access to files by clients. To run API commands on the NameNode and pull metrics, the eG agent needs access to the NameNode's web port. To determine the correct web port of the NameNode, do the following:
Configure the <Port_Number> in the specification as the Name Node Web Port. In the case of the above sample configuration, this will be 50070. |
|
Name Node User Name |
The eG agent collects metrics using Hadoop's WebHDFS REST API. While some of these API calls pull metrics from the NameNode, some others get metrics from the resource manager. NameNode is the master node in the Apache Hadoop HDFS Architecture that maintains and manages the blocks present on the DataNodes (slave nodes). NameNode is a very highly available server that manages the File System Namespace and controls access to files by clients. In some Hadoop configurations, a simple authentication user name may be required for running API commands and collecting metrics from the NameNode. When monitoring such Hadoop installations, specify the name of the simple authentication user here. If no such user is available/required, then do not disturb the default value none of this parameter. |
|
Resource Manager IP and Resource Manager Web Port |
The eG agent collects metrics using Hadoop's WebHDFS REST API. While some of these API calls pull metrics from the NameNode, some others get metrics from the resource manager. The YARN Resource Manager Service (RM) is the central controlling authority for resource management and makes resource allocation decisions. To pull metrics from the resource manager, the eG agents first needs to connect to the resource manager. For this, you need to configure this test with the IP address/host name of the resource manager and its web port. Use the Resource Manager IP and Resource Manager Web Port parameters to configure these details. To determine the IP/host name and web port of the resource manager, do the following:
Configure the <IP_Address_or_Host_Name> in the specification as the Resource Manager IP, and the <Port_Number> as the Resource Manager Web Port. In the case of the above sample configuration, this will be 8080. |
|
Resource Manager Username |
The eG agent collects metrics using Hadoop's WebHDFS REST API. While some of these API calls pull metrics from the NameNode, some others get metrics from the resource manager. The YARN Resource Manager Service (RM) is the central controlling authority for resource management and makes resource allocation decisions. In some Hadoop configurations, a simple authentication user name may be required for running API commands and collecting metrics from the resource manager. When monitoring such Hadoop installations, specify the name of the simple authentication user here. If no such user is available/required, then do not disturb the default value none of this parameter. |
| Measurement | Description | Measurement Unit | Interpretation |
|---|---|---|---|
|
Submitted jobs |
Indicates the number of jobs submitted to this queue during the last measurement period. |
Number |
This is a good indicator of the workload on the queue. |
|
Completed jobs |
Indicates the number of jobs in this queue that were completed during the last measurement period. |
Number |
Ideally, the value of this measure should be high. |
|
Failed jobs |
Indicates the number of jobs in this queue that failed during the last measurement period. |
Number |
Ideally, the value of this measure should be 0. A non-zero value indicates that one/more jobs in a queue have failed. AM (Application Master) container is the brain of the yarn job. It controls the whole life cycle of this job. For any yarn job failure issue or performance issue, always start by checking AM log. Then, to know which application jobs failed, look up the client log, eg Hive log, Spark log or custom application log. You can identify the node on which the AM container was run by checking the RM log or the RM UI for the Yarn job. You can glean which container failed from the AM container log. To know where is the failed container, use the RM log. |
|
Killed jobs |
Indicates the number of jobs in this queue that were killed during the last measurement period. |
Number |
|
|
Running jobs |
Indicates the number of jobs in this queue that are currently running. |
Number |
|
|
Pending jobs |
Indicates the number of jobs in this queue that are pending processing. |
Number |
A low value is desired for this measure. A high value indicates that many jobs are pending processing. This could increase the length of the job queue. A consistent increase in the value of this measure hints at a delay in resource allocation by the scheduler, causing the jobs to wait too long to run. |
|
Jobs running below 60 minutes |
Indicates the number of jobs in this queue that have been running for less than 60 minutes. |
Number |
|
|
Jobs running between 60 and 300 minutes |
Indicates the number of jobs in this queue that have been running for a duration of 1 - 5 hours. |
Number |
|
|
Jobs running between 300 to 1400 minutes |
Indicates the number of jobs in this queue that have been running for a duration of 5 - 24 hours. |
Number |
Ideally, the value of these measures should be low. A high value could indicate problems in resource allocation. |
|
Jobs running more than 1400 minutes |
Indicates the number of jobs in this queue that have been running for over 24 hours. |
Number |