How does eG Enterprise monitor the IBM App Connect Enterprise?
The eG Enterprise is capable of monitoring the IBM App Connect Enterprise in both agent-based and agentless manner. However, the recommended approach is agent-based manner.
For eG Enterprise to monitor IBM App Connect Enterprise, follow the below steps:
-
Install the eG agent on IBM App Connect Enterprise
-
Monitor the Integration server of IBM App Connect Enterprise using a custom channel and custom queues
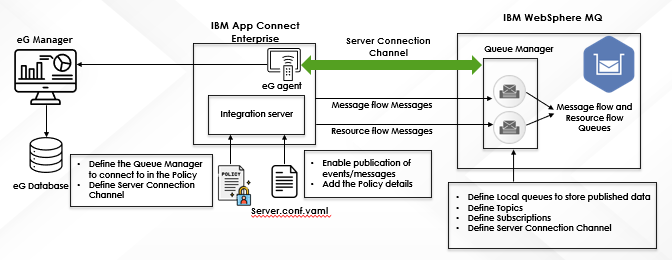
Figure 1 : How eG Monitors IBM ACE
eG Enterprise can also monitor the IBM App Connect Enterprise hosted on Containers such as Docker and Kubernetes. In this case, auto-discovering the Docker/Kubernetes components will automatically discover IBM App Connect Enterprise.
In order to monitor the IBM App Connect Enterprise, certain pre-requisites need to be fulfilled.
Pre-requisites for monitoring IBM App Connect Enterprise
eG enterprise monitors the IBM App Connect Enterprise using an IBM WebSphere MQ server that is loosely coupled with IBM ACE. To start with, ensure that the following steps are in place in the IBM WebSphere MQ server.
- To monitor the IBM ACE, the eG agent installed user should be within the MQM installed user group of the IBM WebSphere MQ server coupled with IBM ACE.
- Create a Queue Manager
- Define Server Connection Channel
- SSL-Enabling the Server Connection Channel
- Creating a Local Queue
- Creating Topics and Subscriptions
- Creating Policy and provide that policy details in server.conf.yaml file
Steps 1 to 4 have already been discussed in the Configuring the eG Agent to Monitor the Queue Manager topic.
Creating a Local Queue
To create a local queue on the IBM WebSphere MQ server, do the following:
Execute the following command from the bin directory of the MQ Install directory so as to start the MQ Series commands (MQSC) for the queue manager:
runmqsc QM_NAME
For example, if the name of the queue manager is QM13, then the command will be as follows:
runmqsc QM13
eG agent is required to connect to two local queues on the IBM WebSphere MQ server in order to subscribe to Snapshot Statistics and Resource statistics topics and collect the required metrics.
To create a local queue on this queue manager, execute the following command:
DEFINE QLOCAL (<QUEUE NAME>) MAXDEPTH(5000) REPLACE
For example, if your <QUEUE NAME> is EG.ACE.FLOWSTATS.SNAPSHOT.INPUTto subscribe to Snapshot Statistics topic and EG.ACE.RESOURCESTATS.INPUT to subscribe to Resource Statistics topic, then the commands will be as below:
DEFINE QLOCAL (EG.ACE.FLOWSTATS.SNAPSHOT.INPUT) MAXDEPTH(5000) REPLACE
DEFINE QLOCAL (EG.ACE.RESOURCESTATS.INPUT) MAXDEPTH(5000) REPLACE
Once the queues are created, you need to subscribe to the Snapshot Statistics and Resource Statistics topics on the IBM WebSphere MQ server coupled with the target IBM ACE. To subscribe to the Snapshot Statistics topic, execute the following command:
DEFINE SUB (<SUBSCRIPTION NAME>) TOPICSTR('$SYS/Broker/integration_server/StatisticsAccounting/SnapShot/<integrationServerName>/#') DEST(<INPUT QUEUE>) REPLACE
Here, integrationServerName is the name of the target IBM ACE that to be monitored.
For example, if your <SUBSCRIPTION NAME> is EG.ACE.FLOWSTATS.SNAPSHOT.SUB, the name of the <INPUT QUEUE> is EG.ACE.FLOWSTATS.SNAPSHOT.INPUT, and the <integrationServerName> is CustomerProcessingIS, then the command will be as below:
DEFINE SUB (EG.ACE.FLOWSTATS.SNAPSHOT.SUB) TOPICSTR('$SYS/Broker/integration_server/StatisticsAccounting/SnapShot/CustomerProcessingIS/#') DEST(EG.ACE.FLOWSTATS.SNAPSHOT.INPUT) REPLACE
To subscribe to the Resource Statistics topic, execute the following command:
DEFINE SUB (<SUBSCRIPTION NAME>) TOPICSTR('$SYS/Broker/integration_server/ResourceStatistics/<integrationServerName>/#') DEST(<INPUT QUEUE>) REPLACE
For example, if your <SUBSCRIPTION NAME> is EG.ACE.RESOURCESTATS.SUB, the name of the <INPUT QUEUE> is EG.ACE.RESOURCESTATS.INPUT, and the <integrationServerName> is CustomerProcessingIS, then the command will be as below:
DEFINE SUB (EG.ACE.RESOURCESTATS.SUB) TOPICSTR('$SYS/Broker/integration_server/ResourceStatistics/CustomerProcessingIS/#') DEST(EG.ACE.RESOURCESTATS.INPUT) REPLACE
If the eG agent installed user is not a part of the MQM installed user group, then you have to execute the following commands:
SET AUTHREC PROFILE('self') PRINCIPAL('$MQ_EG_USER') OBJTYPE(QMGR) AUTHRMV(ALL) AUTHADD(CONNECT,DSP,INQ)
SET AUTHREC PROFILE('**') PRINCIPAL('$MQ_EG_USER') OBJTYPE(CHANNEL) AUTHRMV(ALL) AUTHADD(DSP)
SET AUTHREC PROFILE('SYSTEM.ADMIN.COMMAND.QUEUE') PRINCIPAL('$MQ_EG_USER') OBJTYPE(QUEUE) AUTHRMV(ALL) AUTHADD(INQ,PUT)
SET AUTHREC PROFILE('SYSTEM.DEFAULT.MODEL.QUEUE') PRINCIPAL('$MQ_EG_USER') OBJTYPE(QUEUE) AUTHRMV(ALL) AUTHADD(DSP,INQ,GET)
SET AUTHREC PROFILE('**') PRINCIPAL('$MQ_EG_USER') OBJTYPE(QUEUE) AUTHRMV(ALL) AUTHADD(BROWSE,DSP,GET,INQ)
Here MQ_EG_USER is an example of the eG installed user.
Next, refresh the security cache by issuing the following command:
REFRESH SECURITY(*)
Quit
The queues are now created and the topics are subscribed successfully.
Creating Policies
The eG agent needs to connect to a queue manager in order to collect statistics. For this, the integration server in the ACE needs to be setup.
If you already have a default queue manager enabled in the IBM App Connect Enterprise, then the command will be as follows:
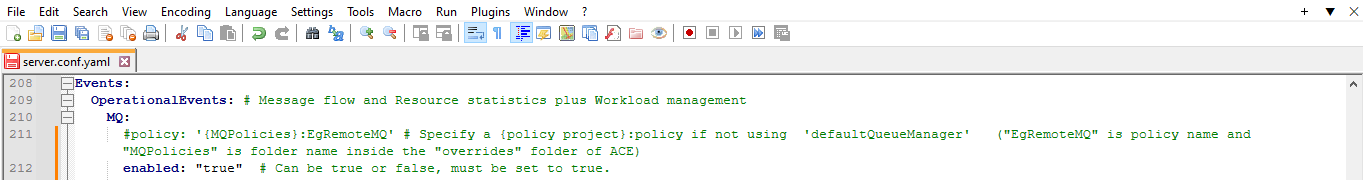
Figure 2 : Enabling default queue manager
In cases where the default queue manager is not enabled, or if you wish to use a new queue manager, do the following:
Open the MQPolicies folder from the run or overrides folder using the following command:
mkdir <ACE_INSTALL_LOCATION>/overrides/MQPolicies
Create a policy named EgRemoteMQ.policyxml for monitoring purposes with the following details:
-
Queue manager name
-
Port number
-
Server Connection Channel name
-
SSL
<?xml version="1.0" encoding="UTF-8"?>
<policies>
<policy policyType="MQEndpoint" policyName="EgRemoteMQ " policyTemplate="MQEndpoint">
<connection>CLIENT</connection>
<destinationQueueManagerName>MQQM</destinationQueueManagerName>
<queueManagerHostname>MQHOST</queueManagerHostname>
<listenerPortNumber>MQPORT</listenerPortNumber>
<channelName>CLNT.EG.SVRCONN</channelName>
<securityIdentity></securityIdentity>
<useSSL>false</useSSL>
<SSLPeerName></SSLPeerName>
<SSLCipherSpec></SSLCipherSpec>
</policy>
</policies>
When a policy is created, a policy descriptor is created alongside. In any case where the policy descriptor is unavailable, you can create a policy.descriptor file in MQPolicies folder with the following details:
<?xml version="1.0" encoding="UTF-8" standalone="yes"?>
<ns2:policyProjectDescriptor xmlns="http://com.ibm.etools.mft.descriptor.base" xmlns:ns2="http://com.ibm.etools.mft.descriptor.policyProject">
<references/>
</ns2:policyProjectDescriptor>
After creating the policy, add the newly created policy references to the server.conf.yaml file in the overrides folder, and update the server.conf.yaml file in the ACE_WORK_DIRECTORY by default. This enables the statistics to be published from which the eG agent will collect metrics.
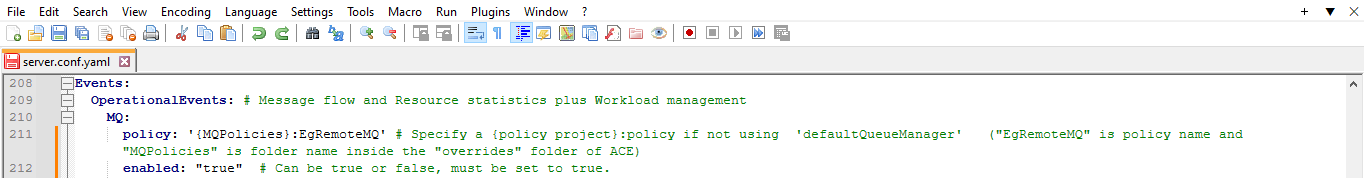
Figure 3 : Specifying the name of the policy
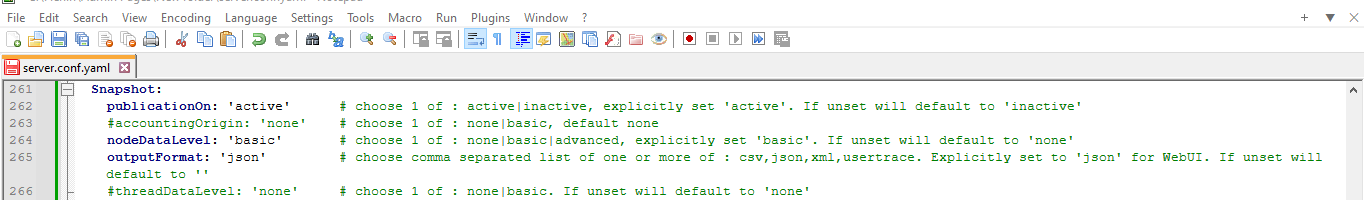
Figure 4 : Capturing basic stats for each node in every resource flow

Figure 5 : Reporting system resource usage
After completing all the above-mentioned steps, restart the IBM App Connect Enterprise server.
Once the pre-requsites are fulfilled, manage the IBM App Connect Enterprise component for monitoring using by eG administrative interface. To know the steps for achieving this, refer to the Managing the IBM App Connect Enterprise