KVM VM Details Test
This test monitors the amount of the physical server’s resources that each virtual machine on a KVM server is taking up. Using the metrics reported by this test, administrators can determine which virtual machine is taking up most CPU, which virtual machine is generating the most network traffic, which virtual machine is over-utilizing memory, which virtual machine has the maximum disk activity, etc.
Target of the test : A KVM server
Agent deploying the test : An internal agent
Outputs of the test : One set of results for each virtual machine of the KVM server that is to be monitored.
| Parameter | Description |
|---|---|
|
Test Period |
How often should the test be executed. |
|
Host |
The IP address of the host for which this test is to be configured. |
|
Port |
The port at which the specified host listens. |
|
Detailed Diagnosis |
To make diagnosis more efficient and accurate, the eG Enterprise embeds an optional detailed diagnostic capability. With this capability, the eG agents can be configured to run detailed, more elaborate tests as and when specific problems are detected. To enable the detailed diagnosis capability of this test for a particular server, choose the On option. To disable the capability, click on the Off option. The option to selectively enable/disable the detailed diagnosis capability will be available only if the following conditions are fulfilled:
|
| Measurement | Description | Measurement Unit | Interpretation | ||||||||||||||||
|---|---|---|---|---|---|---|---|---|---|---|---|---|---|---|---|---|---|---|---|
|
VM state |
Indicates the current status of this VM. |
|
The numeric values that correspond to each of the Measure Values that this test can take are listed in the table below:
Note: By default, this measure reports one of the Measure Values listed in the table above. The graph of this measure however, represents the status of each VM using the numeric equivalents - ‘0’ to ‘6’. |
||||||||||||||||
|
Current sessions |
Indicates the number of sessions currently active on this VM. |
Number |
|
||||||||||||||||
|
Is VM persistent? |
Indicates whether/not the configuration of this VM is persistent. |
|
The numeric values that correspond to each of the Measure Values that this test can take are listed in the table below:
Note: By default, this measure reports one of the Measure Values listed in the table above. The graph of this measure however, represents whether the configuration of this VM is persistent or not using the numeric equivalents - ‘0’ to ‘2’. |
||||||||||||||||
|
Physical CPU utilization |
Indicates the percentage of CPU utilized by this VM. |
Percent |
A very high value of this measure indicates that the VM is currently utilizing high memory resources. |
||||||||||||||||
|
Virtual CPUs |
Indicates the number of virtual CPUs that are allocated to this VM. |
Number |
|
||||||||||||||||
|
Allocated memory |
Indicates the amount of memory that is currently allocated to this VM. |
MB |
|
||||||||||||||||
|
Used memory |
Indicates the amount of memory that is used by this VM. |
MB |
A low value is desired for this measure. |
||||||||||||||||
|
Free memory |
Indicates the amount of memory that is available for use by this VM. |
MB |
A high value is desired for this measure. The memory that is used for reclaimable cache is not considered as free memory. |
||||||||||||||||
|
Memory utilization |
Indicates the percentage of memory that is currently utilized by this VM. |
Percent |
A high value for this measure indicates that the VM is currently running short of memory resources. Comparing the value of this measure across the VMs will help you identify the VM that is using the maximum memory resources. |
||||||||||||||||
|
Memory swap-in |
Indicates the amount of memory that is being swapped in by the server from the disk for this VM. |
MB |
|
||||||||||||||||
|
Memory swap-out |
Indicates the amount of memory that is being swapped to the disk by the server for this VM. |
MB |
|
||||||||||||||||
|
Page faults |
Indicates the number of page faults that occurred for the threads matching all processes. |
Number |
A page fault occurs when a thread refers to a virtual memory page that is not in its working set in main memory. This may not cause the page to be fetched from disk if it is on the standby list and hence already in main memory, or if it is in use by another process with whom the page is shared. |
||||||||||||||||
|
Unused memory |
Indicates the amount of memory that is completely left unused in this VM. |
MB |
The value of this measure is the sum total of the Free memory and the memory that is used for reclaimable caches. |
||||||||||||||||
|
Available memory |
Indicates the amount of memory that is currently available in this VM. |
MB |
|
||||||||||||||||
|
Balloon memory |
Indicates the amount of balloon memory that is currently available for use in this VM. |
MB |
Memory ballooning is a virtual memory management technique used to free unused memory. Having multiple virtual machines (VMs) on a single physical server requires virtual memory management techniques to control resource sharing and to prevent shortages. Some processor chipsets use hardware to offload a portion of the virtual memory management work by creating two layers of page tables, the data structure that provides the mapping between virtual addresses and physical addresses. The layers, however, make it difficult for the hypervisor to see a VM's memory contents, how much memory that VM requires or whether the VM is consuming too much memory. Balloon drivers, which are installed in each VM, transfer the memory shortage from the host (where the shortage exists) to the VM. The hypervisor alerts the balloon driver of low memory instances and instructs it to inflate, which locks a set of unused memory in the VM. The hypervisor can then reassign the physical memory to another VM. This swap activity can potentially impact performance depending upon the amount of memory to recoup and/or the quality of the storage IOPS delivered to the VM. In a VMware environment, the balloon driver only activates when memory becomes scarce, so it’s best to have no ballooning activity at all. In a Windows Server environment, the balloon driver allocates RAM to the VM on-demand. |
||||||||||||||||
|
RSS memory |
Indicates the amount of resident memory that is allocated to the process of this VM. |
MB |
The resident set size is the portion of a process's memory that is held in RAM. The rest of the memory exists in swap or the filesystem (never loaded or previously unloaded parts of the executable). |
||||||||||||||||
|
Disk errors |
Indicates the number of errors that occurred during the disk reads/disk writes of this VM. |
Number |
Ideally, the value of this measure should be zero. Use the detailed diagnosis of this measure to figure out the nature of the errors and the disk on which the errors had occurred. |
||||||||||||||||
|
Data reads |
Indicates the rate at which data is read from the disk of this VM. |
MB/sec |
A high value of this measure indicates that the disk is experiencing high I/O activity. The detailed diagnosis of this measure if enabled, lists the name of the disk and the rate at which data is read from this disk. |
||||||||||||||||
|
Read requests |
Indicates the number of read requests handled by the disk of this VM. |
Number |
The detailed diagnosis of this measure if enabled, lists the name of the disk and the number of requests handled. |
||||||||||||||||
|
Data writes |
Indicates the rate at which data is written to the disk of this VM. |
MB/sec |
The detailed diagnosis of this measure if enabled, lists the name of the disk and the rate at which data is written to the disk. |
||||||||||||||||
|
Write requests |
Indicates the number of write requests handled by the disk of this VM. |
Number |
The detailed diagnosis of this measure if enabled, lists the name of the disk and the number of write requests handled by the disk. |
||||||||||||||||
|
Data transmitted |
Indicates the rate at which data is transmitted from this VM. |
Mbps |
A high value for this measure indicates that the data transmission is high for this VM. The detailed diagnosis of this measure if enabled, lists the name of the network interface through which data is transmitted and the rate at which data is transmitted. |
||||||||||||||||
|
Packets transmitted |
Indicates the rate at which packets are transmitted from this VM. |
Packets/sec |
A high value for this measure indicates that the data transmission is high for this VM. The detailed diagnosis of this measure if enabled, lists the name of the network interface through which the packets are transmitted and the rate at which the packets are transmitted. |
||||||||||||||||
|
Data dropped during transmission |
Indicates the number of data packets that were dropped during transmission. |
Number |
The detailed diagnosis of this measure if enabled, lists the name of the network interface that dropped the data and the number of data packets dropped. |
||||||||||||||||
|
Errors during transmission |
Indicates the number of errors encountered by this VM during transmission. |
Number |
Ideally, the value of this measure should be zero. The detailed diagnosis of this measure if enabled, lists the name of the network interface and the number of errors that were enocuntered. |
||||||||||||||||
|
Data received |
Indicates the rate at which data is received on this VM. |
Mbps |
The detailed diagnosis of this measure if enabled, lists the name of the network interface and the rate at which data was received. |
||||||||||||||||
|
Packets received |
Indicates the rate at which data packets were received by this VM. |
Packets/sec |
The detailed diagnosis of this measure if enabled, lists the name of the network interface and the rate at which the data packets were received. |
||||||||||||||||
|
Data dropped during reception |
Indicates the number of data packets that were dropped during reception by this VM. |
Packets/sec |
Ideally, the value of this measure should be zero. The detailed diagnosis of this measure if enabled, lists the name of the network interface and the number of data packets that were dropped during reception. |
||||||||||||||||
|
Errors during reception |
Indicates the number of errors encountered during data reception by this VM. |
Number |
Ideally, the value of this measure should be zero. The detailed diagnosis of this measure if enabled, lists the name of the network interface and the number of errors encountered during data reception. |
||||||||||||||||
|
Allocated size |
Indicates the cumulative allocated size of the disks of this VM. |
MB |
The detailed diagnosis of this measure if enabled, lists the name of each disk and the size allocated to each disk. |
||||||||||||||||
|
Physical size |
Indicates the physical size of this VM. |
MB |
The detailed diagnosis of this measure if enabled, lists the name of each disk and the physical size that is available in each disk. |
||||||||||||||||
|
Logical size |
Indicates the current logical size of this VM. |
MB |
The detailed diagnosis of this measure if enabled, lists the name of each disk and the logical size of each disk. |
||||||||||||||||
|
Free physical size |
Indicates the physical size of this VM that is currently free. |
MB |
A high value is desired for this measure. The detailed diagnosis of this measure if enabled, lists the name of each disk and the physical size that is currently free. |
||||||||||||||||
|
Percentage of physical size utilized |
Indicates the percentage of space that is already utilized by this VM. |
Percent |
A value close to 100% indicates that the VM is currently running out of physical space. The detailed diagnosis of this measure if enabled, lists the name of each disk and the percentage of space utilized by each disk of the VM. |
The detailed diagnosis of the Data reads measure lists the name of the disk and the rate at which data is read from this disk. Administrators can instantly identify the disk that is experiencing high I/O activity using the detailed diagnosis.
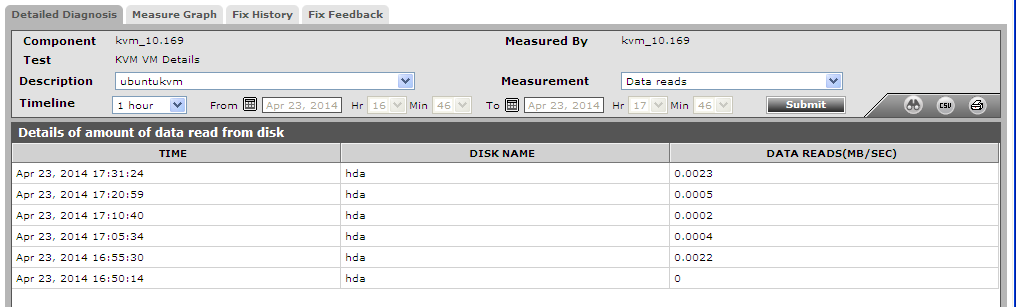
Figure 1 : The detailed diagnosis of the Data reads measure
The detailed diagnosis of the Read requests measure if enabled, lists the name of the disk and the number of requests handled. This way, administrators can identify the disk that is handling the maximum number of requests.
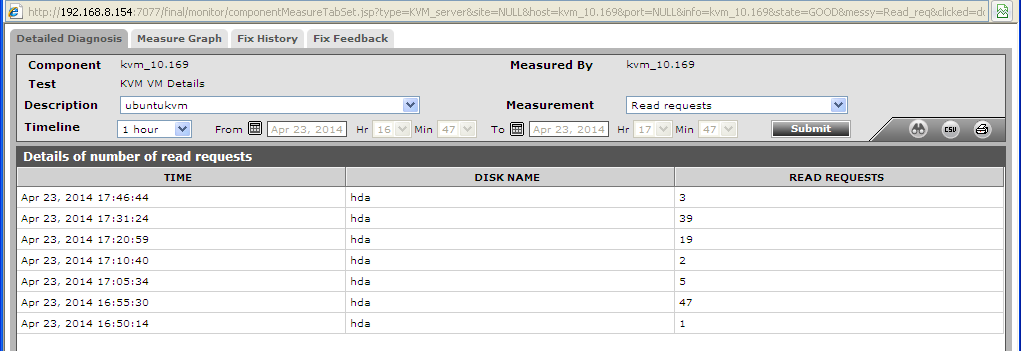
Figure 2 : The detailed diagnosis of the Read requests measure
The detailed diagnosis of the Data writes measure lists the name of the disk and the rate at which data is written to the disk.
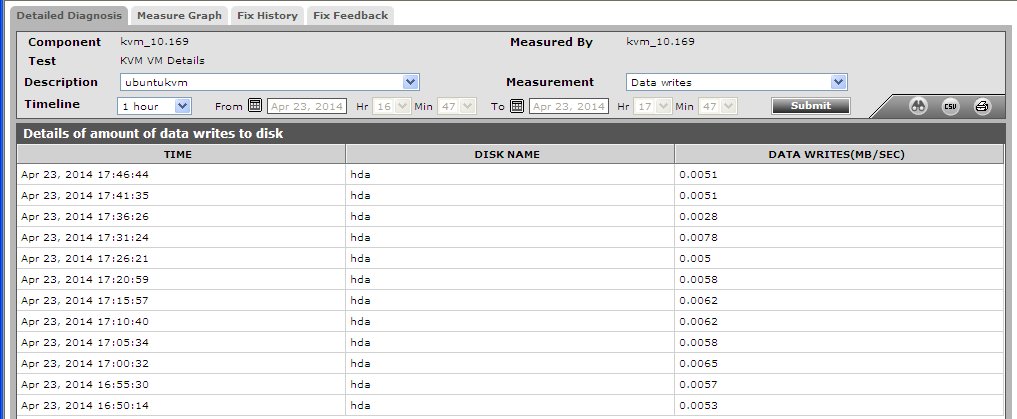
Figure 3 : The detailed diagnosis of the Data writes measure
The detailed diagnosis of the Write requests measure if enabled, lists the name of the disk and the number of write requests handled by the disk.
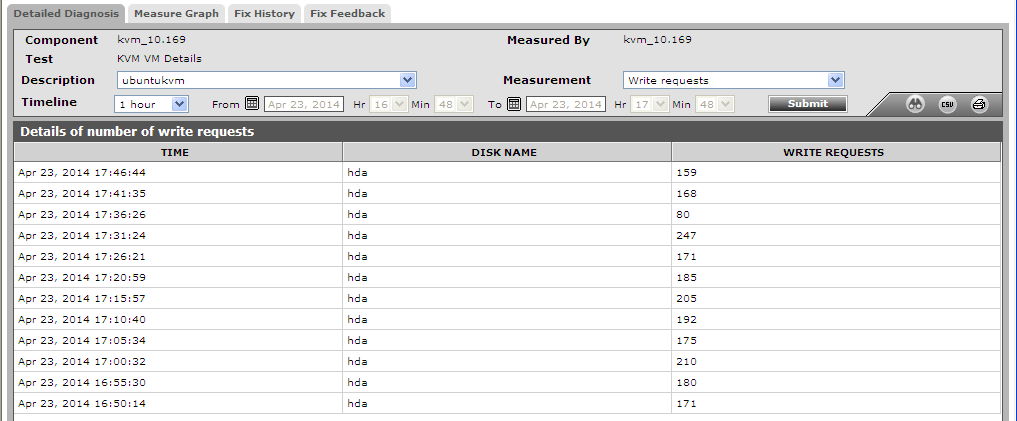
Figure 4 : The detailed diagnosis of the Write requests measure
The detailed diagnosis of the Data transmitted measure if enabled, lists the name of the network interface through which data is transmitted and the rate at which data is transmitted.
Figure 5 : The detailed diagnosis of the Data transmitted measure
The detailed diagnosis of the Data received measure if enabled, lists the name of the network interface and the rate at which data was received.
Figure 6 : The detailed diagnosis of the Data received measure
The detailed diagnosis of the Packets transmitted measure, lists the name of the network interface through which the packets are transmitted and the rate at which the packets are transmitted.
Figure 7 : The detailed diagnosis of the Packets transmitted measure
The detailed diagnosis of the Packets received measure if enabled, lists the name of the network interface and the rate at which the data packets were received.
Figure 8 : The detailed diagnosis of the Packets received measaure