AVD Host Pools - Overview Test
Use the AVD Host Pools test to know the constitution of every host pool managed by your AVD broker. Be instantaneously alerted to changes in a pool's constitution/configuration.
For each host pool, this test reports the number and names of applications, application groups, desktops, and session hosts in that pool. Alerts are sent out if session hosts are added to or removed from any pool. The status of every host pool is also tracked, and the unavailability of a pool is promptly reported.
Target of the Test: A Microsoft AVD Broker
Agent deploying the test: A remote agent
Output of the test: One set of results for each AVD host pool managed by the target AVD broker, in each resource group of the configured subscription
| Parameters | Description |
|---|---|
|
Test Period |
How often should the test be executed. |
|
Host |
The host for which the test is to be configured. |
|
Subscription ID |
Specify the GUID which uniquely identifies the Microsoft Azure Subscription to be monitored. To know the ID that maps to the target subscription, do the following:
|
|
Tenant ID |
Specify the Directory ID of the Azure AD tenant to which the target subscription belongs. To know how to determine the Directory ID, refer to Configuring the eG Agent to Monitor a Microsoft AVD Broker Using Azure ARM REST API |
|
Client ID and Client Password |
To collect the required metrics, the eG agent requires an Access token in the form of an Application ID and the client secret value. If a Microsoft Azure Subscription component or a Microsoft Azure Active Directory component is already being monitored, then an Application would have already been created for monitoring purposes. The Application ID and Client Secret of such an application can be specified here. However, if no such application exists, then you will have to create one for monitoring the AVD broker. To know how to create such an application and determine its Application ID and Client Secret, refer to Configuring the eG Agent to Monitor a Microsoft AVD Broker Using Azure ARM REST API. Specify the Application ID of the created Application in the Client ID text box and the client secret value in the Client Password text box. |
|
Proxy Host |
In some environments, all communication with the Azure cloud be routed through a proxy server. In such environments, you should make sure that the eG agent connects to the cloud via the proxy server and collects metrics. To enable metrics collection via a proxy, specify the IP address of the proxy server and the port at which the server listens against the Proxy Host and Proxy Port parameters. By default, these parameters are set to none, indicating that the eG agent is not configured to communicate via a proxy, by default. |
|
Proxy Username, Proxy Password and Confirm Password |
If the proxy server requires authentication, then, specify a valid proxy user name and password in the Proxy Username and Proxy Password parameters, respectively. Then, confirm the password by retyping it in the Confirm Password text box. |
|
Detailed Diagnosis |
To make diagnosis more efficient and accurate, eG Enterprise embeds an optional detailed diagnostic capability. With this capability, the eG agents can be configured to run detailed, more elaborate tests as and when specific problems are detected. To enable the detailed diagnosis capability of this test for a particular server, choose the On option. To disable the capability, click on the Off option. The option to selectively enable/disable the detailed diagnosis capability will be available only if the following conditions are fulfilled:
|


| Measurement | Description | Measurement Unit | Interpretation | ||||||
|---|---|---|---|---|---|---|---|---|---|
|
Status |
Indicates whether/not this host pool is available currently. |
|
The values that this measure reports and their corresponding numeric values are listed in the table below:
Note: By default, this measure reports the Measure Values listed in the table above to indicate the current status of the host pool. In the graph of this measure however, the same is represented using the numeric equivalents only. Use the detailed diagnosis of this measure to view the friendly name of the host pool, host pool type, load balancer type, and maximum number of sessions allowed on the host pool. |
||||||
|
Total application groups |
Indicates the number of application groups installed on the session hosts in this pool. |
Number |
An app group is a logical grouping of applications installed on session hosts in the host pool. Use the detailed diagnosis of this measure to know which application groups are managed by the host pool. |
||||||
|
Total applications |
Indicates the total number of RemoteApps individually selected and published to all the RemoteApp application groups in this host pool. |
Number |
Use the detailed diagnosis of this measure to know which RemoteApps are published to which application group in the host pool. |
||||||
|
Total desktops |
Indicates the total number of full desktops grouped into desktop application groups in this host pool. |
Number |
Use the detailed diagnosis of this measure to know which desktops are published to which application group in the host pool. |
||||||
|
Total session hosts |
Indicates the total number of session hosts in this host pool. |
Number |
The detailed diagnosis of this measure reveals the names of the session hosts in the host pool, and their current status. For each session host, the detailed metrics further reveals whether new sessions are allowed or not in the session host, when the last heart beat was sent by the session host, the total number of sessions on the host, and whether update succeeded/failed on the host. From this, you can quickly identify the session hosts that have been down - i.e., that have not sent heart beats - for a long time. The hosts on which upgrade failed can also be pinpointed. |
||||||
|
Session hosts added |
Indicates the number of session hosts that were newly added to this host pool. |
Number |
Use the detailed diagnosis of this measure to know which session hosts were added recently. |
||||||
|
Session hosts removed |
Indicates the number of session hosts that were recently removed from this host pool. |
Number |
Use the detailed diagnosis of this measure to know which session hosts were removed recently. |
||||||
|
Average estimated round trip time |
Indicates the average time taken for a network packet to travel from the end-user’s device to this host pool through the network and back. |
Seconds |
Ideally, the value of this measure should be low. A high value for this measure may suggest potential network congestion or other network-related issues affecting the user experience. |
||||||
|
Average estimated available bandwidth |
Indicates the average bandwidth available for users connecting to this host pool. |
Kbps |
This value offers crucial insight into the network's ability to support the workload. A high value for this measure indicates better network performance and a smoother user experience. On the other hand, a low value for this measure indicates potential network congestion or limitations that could impact the responsiveness of applications and services hosted on the host pool. |
Use the detailed diagnosis of the Status measure to view the friendly name of the host pool, host pool type, load balancer type, and maximum number of sessions allowed on the host pool.

Figure 3 : The detailed diagnosis of the Status measure reported by the AVD Host Pools - Overview test
Use the detailed diagnosis of the Total application groups measure to know which application groups are managed by the host pool, and how many applications / desktops each group contains.
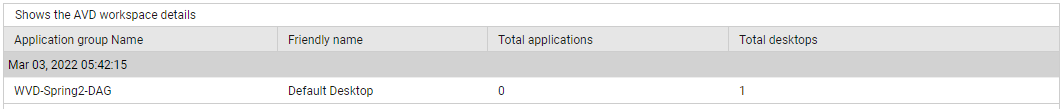
Figure 4 : The detailed diagnosis of the Total application groups measure reported by the AVD Host Pools - Overview test