AVD Overview Test
Use this test if you want to receive a macro-level view of the composition of your Azure Virtual Desktop environment. This test reveals the total number of workspaces, application groups, and host pools that have been configured across the AVD environment. Detailed diagnostics reveals the exact names of the workspaces, application groups, and host pools.
Target of the Test: A Microsoft AVD Broker
Agent deploying the test: A remote agent
Output of the test: One set of results for the AVD environment managed by the monitored broker
| Parameters | Description |
|---|---|
|
Test Period |
How often should the test be executed. |
|
Host |
The host for which the test is to be configured. |
|
Subscription ID |
Specify the GUID which uniquely identifies the Microsoft Azure Subscription to be monitored. To know the ID that maps to the target subscription, do the following:
|
|
Tenant ID |
Specify the Directory ID of the Azure AD tenant to which the target subscription belongs. To know how to determine the Directory ID, refer to Configuring the eG Agent to Monitor a Microsoft AVD Broker Using Azure ARM REST API |
|
Client ID and Client Password |
To collect the required metrics, the eG agent requires an Access token in the form of an Application ID and the client secret value. If a Microsoft Azure Subscription component or a Microsoft Azure Active Directory component is already being monitored, then an Application would have already been created for monitoring purposes. The Application ID and Client Secret of such an application can be specified here. However, if no such application exists, then you will have to create one for monitoring the AVD broker. To know how to create such an application and determine its Application ID and Client Secret, refer to Configuring the eG Agent to Monitor a Microsoft AVD Broker Using Azure ARM REST API. Specify the Application ID of the created Application in the Client ID text box and the client secret value in the Client Password text box. |
|
Proxy Host |
In some environments, all communication with the Azure cloud be routed through a proxy server. In such environments, you should make sure that the eG agent connects to the cloud via the proxy server and collects metrics. To enable metrics collection via a proxy, specify the IP address of the proxy server and the port at which the server listens against the Proxy Host and Proxy Port parameters. By default, these parameters are set to none, indicating that the eG agent is not configured to communicate via a proxy, by default. |
|
Proxy Username, Proxy Password and Confirm Password |
If the proxy server requires authentication, then, specify a valid proxy user name and password in the Proxy Username and Proxy Password parameters, respectively. Then, confirm the password by retyping it in the Confirm Password text box. |
|
Detailed Diagnosis |
To make diagnosis more efficient and accurate, eG Enterprise embeds an optional detailed diagnostic capability. With this capability, the eG agents can be configured to run detailed, more elaborate tests as and when specific problems are detected. To enable the detailed diagnosis capability of this test for a particular server, choose the On option. To disable the capability, click on the Off option. The option to selectively enable/disable the detailed diagnosis capability will be available only if the following conditions are fulfilled:
|


| Measurement | Description | Measurement Unit | Interpretation |
|---|---|---|---|
|
Total workspaces |
Indicates the total number of workspaces created. |
Number |
A workspace is a logical grouping of application groups in Azure Virtual Desktop. Each Azure Virtual Desktop application group must be associated with a workspace for users to see the remote apps and desktops published to them. Use the detailed diagnosis of this this measure to know the names of the workspaces created in the target AVD environment. The location of each workspace and the number of application groups associated with every workspace are also reported as part of detailed diagnostics. |
|
Total host pools |
Indicates the total number of host pools managed by the AVD environment. |
Number |
To know which host pools are being managed, use the detailed diagnosis of this measure. For each host pool, the detailed analytics also reveal the location and type of that host pool, the count of application groups managed by that host pool, and the maximum number of sessions that can be handled by that pool. |
|
Total application groups |
Indicates the number of application groups installed on all the session hosts in the target AVD environment. |
Number |
An app group is a logical grouping of applications installed on session hosts in the host pool. Use the detailed diagnosis of this measure to know which application groups are managed by which host pool and workspace. |
Use the detailed diagnosis of the Total application groups measure to know which application groups are managed by which host pool and workspace.
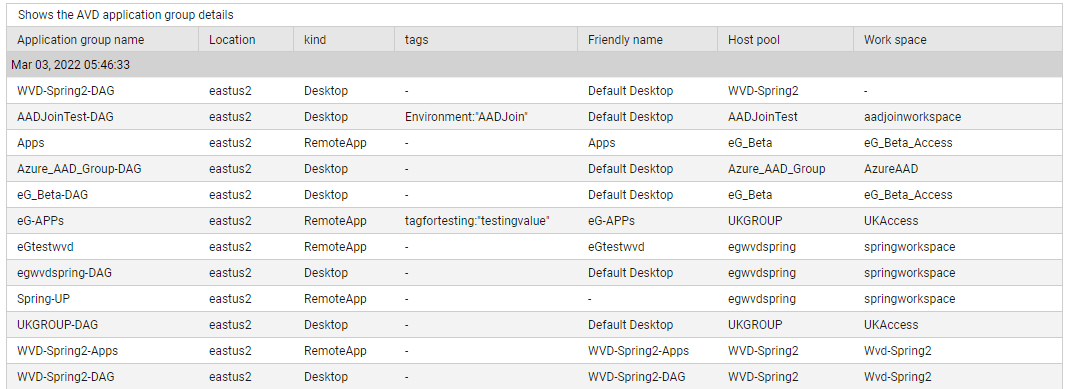
Figure 3 : The detailed diagnosis of the Total application groups measure reported by the AVD Overview test
Use the detailed diagnosis of the Total host pools measure to know which host pools are being managed by the AVD service. For each host pool, the detailed analytics also reveal the location and type of that host pool, the count of application groups managed by that host pool, and the maximum number of sessions that can be handled by that pool.
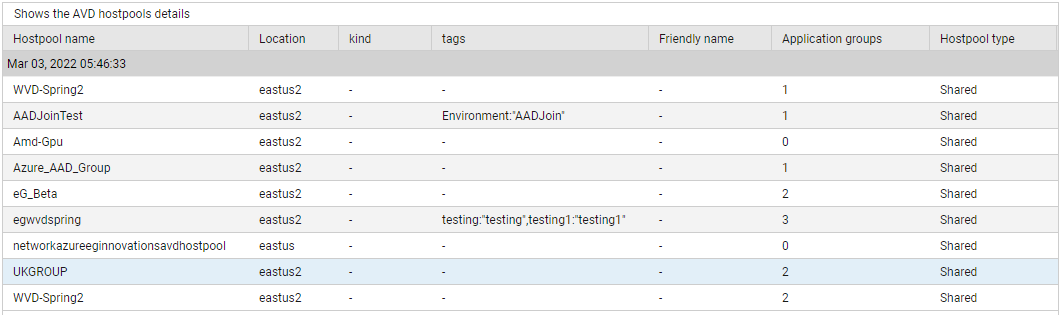
Figure 4 : The detailed diagnosis of the Total host pools measure