Exchange Store Test
A mailbox database in the Exchange Store is said to be in good health if:
- The mailbox database processes RPC requests from clients quickly;
- The message load on the mailbox database is commensurate to its processing ability;
- The mailbox database does not consist of any quarantined mailboxes
- The mailbox database is well-maintained by configuring maintenance schedules
This implies that a slowdown in processing RPC requests, a delay in email delivery/submission, or one/more corrupted mailboxes in the database, can severely hamper mailbox database health. This in turn can significantly impact the user experience with the mailbox server. If this is to be avoided, administrators should keep a watchful eye on all aspects of performance of every mailbox database on the Exchange server, so that they can proactively capture current/potential failures/delays. This is where the Exchange Store test helps. For every mailbox database on the Exchange server, this test measures the load on the database, the processing ability of the database, and the overall health and upkeep of the database. In the process, the test accurately pinpoints those mailbox databases where something is wrong and provides pointers to what could be wrong!
Target of the test : A Microsoft Exchange 2013/2016 server
Agent deploying the test : An internal agent
Outputs of the test : One set of results for each mailbox database
|
| Measurement | Description | Measurement Unit | Interpretation |
|---|---|---|---|
|
Percentage of RPC requests: |
Indicates the percent of MAPI RPCs that are currently in progress in this database as compared to the maximum allowed. |
Percent |
If the value of this measure keeps growing close to 100% at a rapid pace, it could indicate increased RPC load or a bottleneck in one or more resources. If the value touches 100%, then the mailbox database will deny new connections. To resolve this problem, determine the resources that are creating a bottleneck, and then try to mitigate the problem. Possible bottlenecks are disk reads or writes, processor time, available memory, and network configuration. |
|
Active mailboxes: |
Indicates the number of active mailboxes in this database. |
Number |
Use the detailed diagnosis of this measure to know the names of the active mailboxes and the number of items in each mailbox. |
|
Database maintenance rate: |
Indicates the rate at which database level maintenances are processed by this database. |
Maintenances/Sec |
A high value is desired for this measure. Compare the value of this measure across databases to know which database is processing database-level maintenance tasks slowly. |
|
Full-refresh rate of lazy indexes: |
Indicates the number of lazy indexes being full refreshed per second by this database. |
Refresh/Sec |
|
|
Incremental refresh rate of lazy indexes: |
Indicates the number of lazy indexes being incrementally refreshed per second by this database. |
Refresh/Sec |
|
|
Invalidated lazy indexes: |
Indicates the rate at which lazy indexes are being invalidated by this database due to the version incompatibility. |
Invalidation/Sec |
A low value is desired for this measure. |
|
Lazy indexes creation rate: |
Indicates the rate at which this database creates lazy indexes. |
Created/Sec |
|
|
Lazy indexes deletion rate: |
Indicates the rate at which this database deletes lazy indexes. |
Deleted/Sec |
|
|
Mailbox maintenance items: |
Indicates the number of mailbox maintenance items in this database. |
Number |
|
|
Mailbox maintenance rate: |
Indicates the rate at which this database processes mailbox level maintenances. |
Maintenances/Sec |
A high value is desired for this measure. Compare the value of this measure across databases to know which database is processing mailbox-level maintenance tasks slowly. |
|
Mailboxes with maintenance items: |
Indicates the number of mailboxes with maintenance items. |
Number |
|
|
Message delivery rate: |
Indicates the number of messages delivered to this database per second. |
Msgs/Sec |
|
|
Message submission rate: |
Indicates the rate at which messages were submitted by this database for delivery. |
Msgs/Sec |
Ideally, the value of this measure should be high. Compare the value of this measure across databases to in which database mail delivery is bottlenecked. |
|
Active background tasks: |
Indicates the number of background tasks currently executing in this database. |
Number |
|
|
Active WLM tables under maintenance: |
Indicates the number of active WLM LogicalIndex maintenance tables under maintenance in this database. |
Number |
|
|
Mailboxes with WLM tables under maintenance: |
Indicates the number of mailboxes in this database that are marked for WLM LogicalIndex maintenance table maintenance. |
Number |
|
|
Currently processing maintenance tasks: |
Indicates the number of maintenance tasks that are currently processed by this database. |
Number |
This is a good indicator of the maintenance workload on the database. |
|
Maintenance tasks scheduled: |
Indicates the number of LogicalIndex maintenance tasks scheduled for this database. |
Number |
This is a good indicator of the potential maintenance workload on the database. |
|
Rate of property promoted messages: |
Indicates the rate at which properties were promoted for messages in this database. |
Messages/Sec |
Property promotion refers to the process of extracting values from properties of a message and writing those values to corresponding columns on the database where the document is stored. When the message property changes, the changes can be automatically written back to the database. |
|
Property promotions rate: |
Indicates the rate at notepwhich this database promoted message properties. |
Promotions/Sec |
Ideally, the value of this measure should be high. A low value is indicative of a bottleneck when performing property promotions. |
|
Quarantined mailboxes: |
Indicates the number of mailboxes in this database that are quarantined. |
Number |
Ideally, the value of this measure should be 0. A non-zero value is indicative of a quarantined mailbox in the database. Quarantining is designed to detect clients that are taking up too much of the Store’s attention because something is going wrong. MAPI clients like Outlook use multiple threads within the Store process when they connect to mailboxes. If one or more of these threads “freeze” for some reason, they can cause the Store to consume more CPU than it should in an attempt to service the thread. The problem might be caused by corrupt mailbox data or a software bug in either the client or Store process or some other reason such as network failure. In any case, the freezing of threads or their abnormal termination is bad news! Quarantining is performed by a background thread that runs every two hours within the Store to check the number of crashes experienced by mailboxes. If a mailbox exceeds the crash threshold it is deemed to be a threat to the overall stability of the Store and is therefore put into quarantine. Compare the value of this measure across databases to know which database has the maximum number of quarantined mailboxes. If this value is very high, it could be because a very small crash threshold has been set for that database. If so, you may want to change this crash threshold, so that fewer mailboxes are quarantined. |
|
RPC average latency: |
Indicates the amount of time spent by this database in RPC request processing. |
Secs |
This value should be below 0.05 seconds at all times. A slowdown in RPC packet processing can adversely impact the user experience. |
|
RPC operations rate: |
Indicates the rate at which this database processes RPC operations. |
Operations/Sec |
Generally, spikes in RPC requests that do not increase RPC operations rate indicate that there are bottlenecks preventing the store from fulfilling the requests in a timely manner. It is relatively simple to identify where the bottlenecks are occurring with regards to RPC requests and RPC operations rate. If the client experiences delays, but the RPC requests are zero and the RPC operations rate is low, the performance problem is happening before Exchange processes the requests (that is, before the Microsoft Exchange Information Store service actually gets the incoming requests). All other combinations point to a problem either while Exchange processes the requests or after Exchange processes those requests. |
|
RPC packets rate: |
Indicates the rate at which RPC packets are processed by this database. |
Packets/Sec |
A consistent drop in this value could indicate a slowdown in RPC request processing. |
|
Pending pool RPC async notification calls: |
Indicates the total number of async notification calls pending in all RPC context handle pools of this database. |
Number |
Async MAPI Notifications use Asynchronous RPC to receive notifications from the Exchange Server. This allows MAPI to park a request with the Exchange Server and not have to wait for the next remote operation to get notifications. |
|
Active RPC context handle pools: |
Indicates the number of active RPC context handle pools of this database. |
Number |
|
|
RPC requests: |
Indicates the number of MAPI RPC requests currently in progress in this database. |
Number |
This is a good indicator of the current RPC workload of the database. |
The detailed diagnosis of the Active Mailboxes measure reveals the names of the active mailboxes on a particular mailbox database and the number of items in each mailbox.
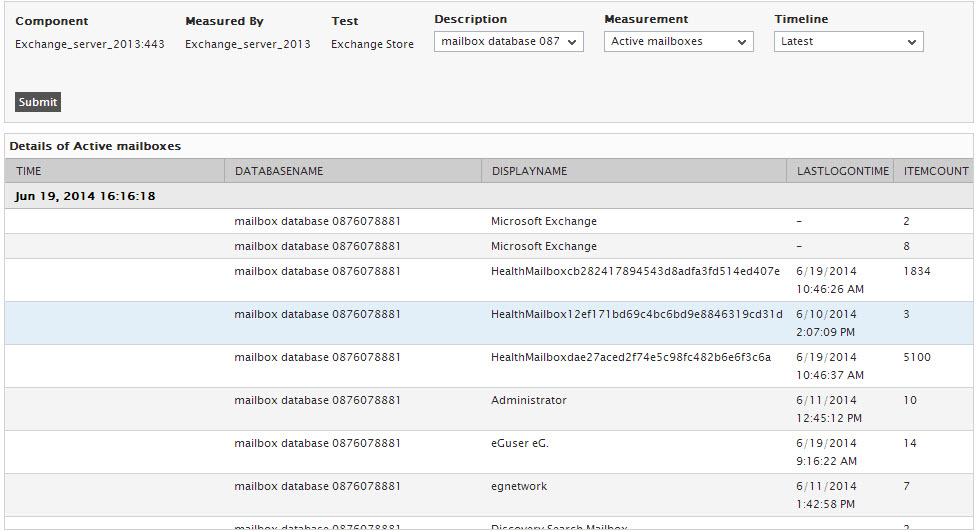
Figure 2 : The detailed diagnosis of the Active mailboxes measure