Health Analyzer Alerts
SharePoint includes a tool named SharePoint Health Analyzer that enables you to diagnose and resolve configuration, performance, and usage problems. SharePoint Health Analyzer runs predefined health rules against servers in the farm. A health rule runs a test and returns an alert that tells you the outcome of the test. Every alert will indicate its severity – i.e., whether it is an Error, Warning, Information, or a Rule execution failure. Also, depending upon their nature, alerts are also automatically grouped into any of the standard categories, namely – Security, Performance, Configuration, or Availability – or can be part of any user-configured category. Every alert will also indicate the category to which it belongs.
The Health Analyzer Alerts test captures these alerts, ascertains their severity and category, and reports the count of alerts that were raised per severity for every category of alerts. You can also use the detailed diagnostics provided by this test to view the complete alert messages, the health rules that generated the alerts, and the server and services that were impacted by the problems for which the alerts were generated. This will not only lead you to the problem areas, but will also shed light on the probable problem cause, so that you can resolve the issue quickly.
Target of the test : A Microsoft SharePoint Server
Agent deploying the test : An internal agent
Outputs of the test : One set of results for each alert category
| Parameters | Description |
|---|---|
|
Test period |
This indicates how often should the test be executed. |
|
Host |
The host for which the test is to be configured. |
|
Port |
The port at which the host server listens. |
|
Fetch Farm Measures |
Typicaly, farm-level metrics - eg., metrics on farm status, site collections, usage analytics - will not vary from one SharePoint server in the farm to another. If these metrics are collected and stored in the eG database for each monitored server in the SharePoint farm, it is bound to unnecessarily consume space in the database and increase processing overheads. To avoid this, farm-level metrics collection is by default switched off for the member servers in the SharePoint farm, and enabled only if the server being monitored is provisioned as the Central Administration site. Accordingly, this parameter is set to If Central Administration by default. This default setting ensures that farm-level metrics are collected from and stored in the database for only a single SharePoint server in the farm. If you want to completely switch-off farm-level metrics collection for a SharePoint farm, then set this parameter to No. Some high-security environments may not allow an eG agent to be deployed on the Central Administration site. Administrators of such environments may however require farm-level insights into status and performance. To provide these insights for such environments, you can optionally enable farm-level metrics collection from any monitored member server in the farm, even if that server is not provisioned as the Central Administration site. For this, set this parameter to Yes when configuring this test for that member server. |
|
Domain, Domain User, Password, and Confirm Password |
If the Fetch Farm Measures flag of these tests is set to No or to If Central Administration Site, then this test should be configured with the credentials of a user with the following privileges:
On the other hand, if the Fetch Farm Measures flag of these tests is set to Yes, then the user configured for the tests not only requires the four privileges discussed above, but should also be part of the following groups on the eG agent host:
It is recommended that you create a special user for this purpose and assign the aforesaid privileges to him/her. Once such a user is created, specify the domain to which that user belongs in the Domain text box, and then, enter the credentials of the user in the Domain User and Password text boxes. To confirm the password, retype it in the Confirm Password text box. |
|
Detailed Diagnosis |
To make diagnosis more efficient and accurate, the eG Enterprise embeds an optional detailed diagnostic capability. With this capability, the eG agents can be configured to run detailed, more elaborate tests as and when specific problems are detected. To enable the detailed diagnosis capability of this test for a particular server, choose the On option. To disable the capability, click on the Off option. The option to selectively enable/disable the detailed diagnosis capability will be available only if the following conditions are fulfilled:
|
| Measurement | Description | Measurement Unit | Interpretation |
|---|---|---|---|
|
Error messages |
Indicates the total number of error alerts of this category that were generated by the Health Analyzer. |
Number |
Ideally, the value of this measure should be 0. If a non-zero value is reported, then use the detailed diagnosis of this measure to understand the errors that occurred and the servers and services impacted by the same. |
|
Warning messages |
Indicates the total number of warning alerts of this category that were generated by the Health Analyzer . |
Number |
Ideally, the value of this measure should be 0. If a non-zero value is reported, then use the detailed diagnosis of this measure to view the warning messages and the servers and services that may be impacted by the warnings. |
|
Information messages |
Indicates the total number of information alerts of this category that were generated by the Health Analyzer. |
Number |
Use the detailed diagnosis of this measure to view the information messages and the servers and services that they pertain to. |
|
Rule execution failure messages |
Indicates the total number of rule execution failure messages of this category that were generated by the Health Analyzer. |
Number |
Ideally, the value of this measure should be 0. If a non-zero value is reported, then use the detailed diagnosis of this measure to view the descriptive messages and to determine which servers and services failed because of rule execution failure. |
Use the detailed diagnosis of the Error messages measure to understand what errors occurred, when, and which servers and services impacted by the same.
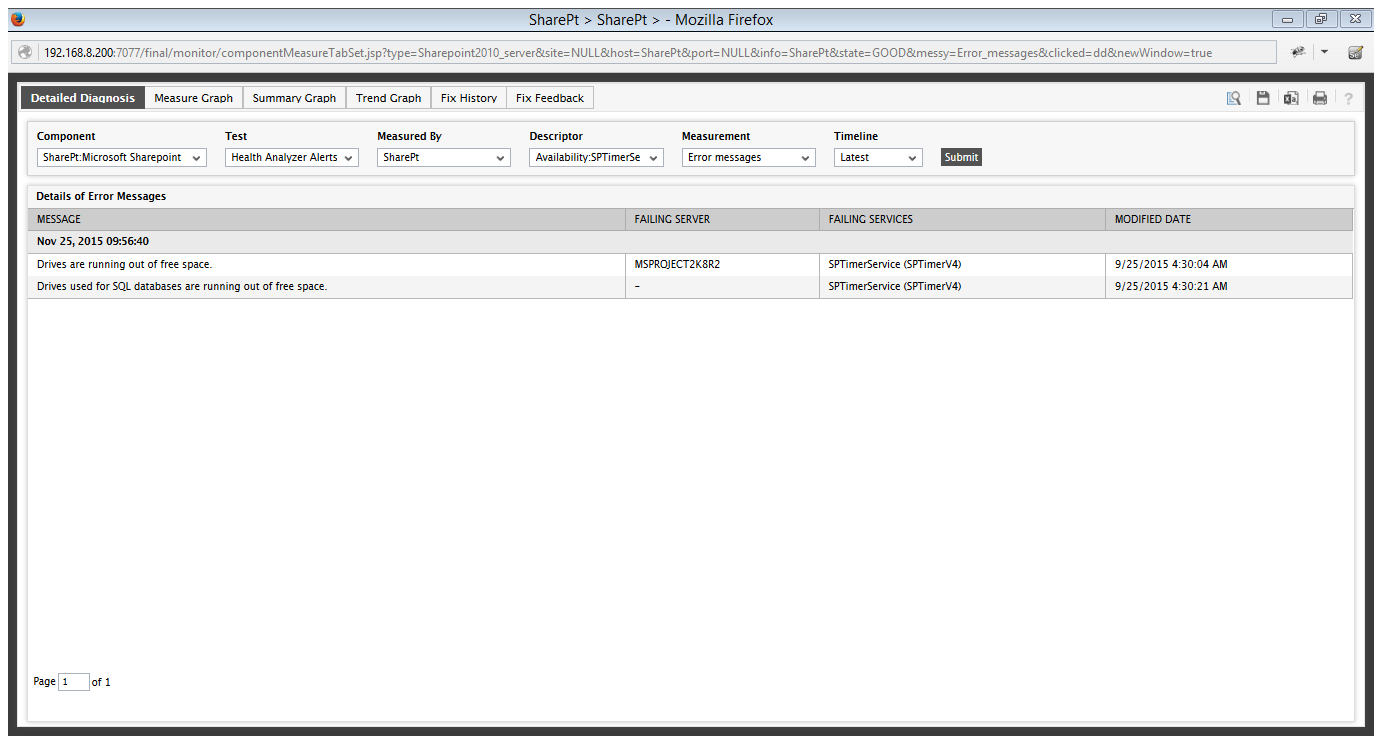
Figure 1 : The detailed diagnosis of the Error messages measure
Use the detailed diagnosis of the Warning messages measure to view the warning messages and the servers and services that will potentially be impacted if the warnings are ignored.
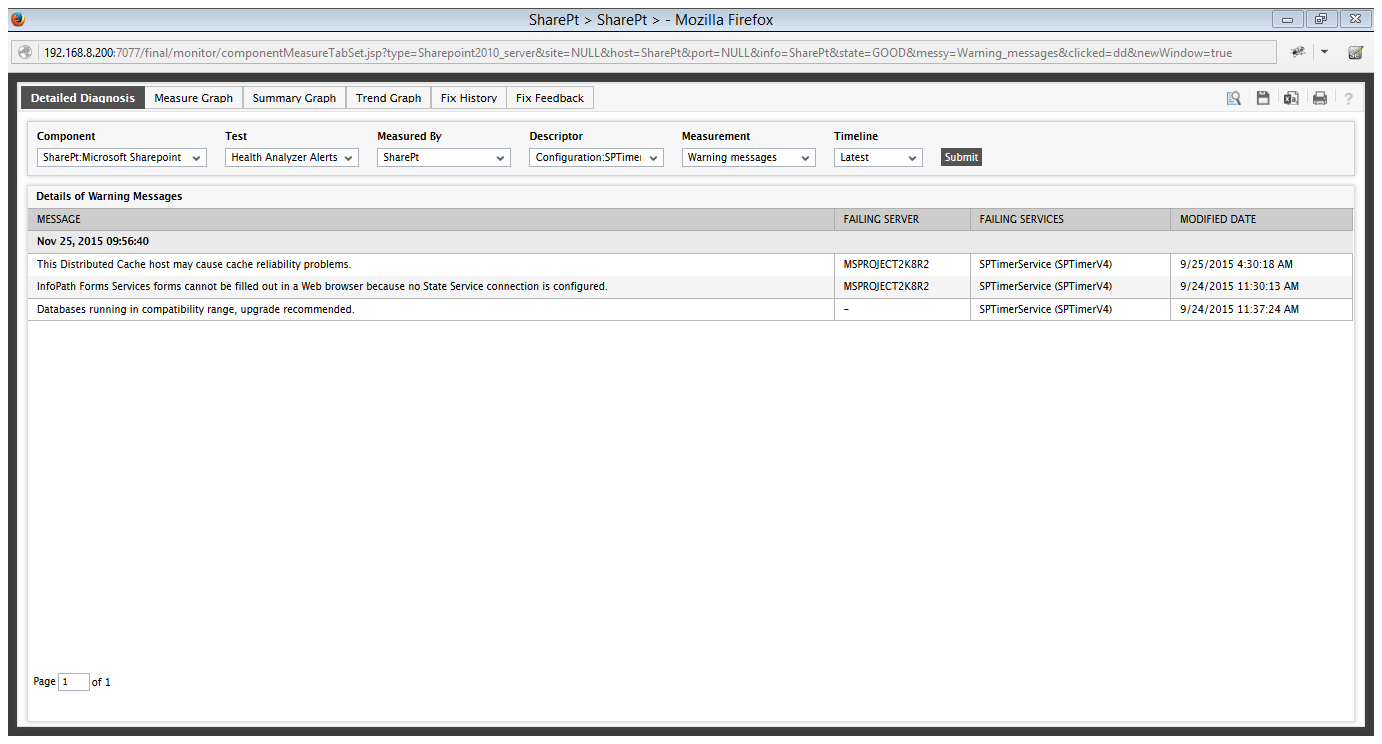
Figure 2 : The detailed diagnosis of the Warning messages measure
Use the detailed diagnosis of the Information messages measure to view the information messages and the servers and services they pertain to.
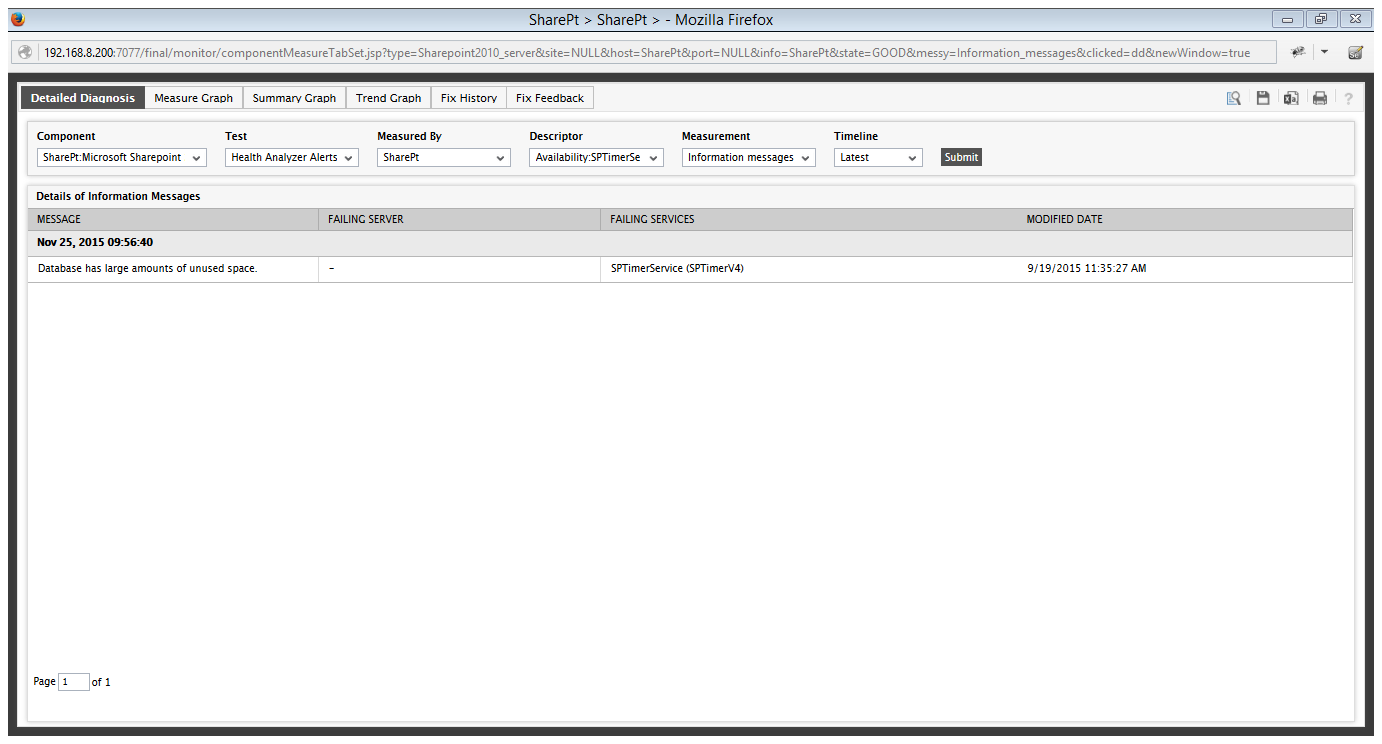
Figure 3 : The detailed diagnosis of the Information messages measure
Use the detailed diagnosis of the Rule execution failure messages measure to view the descriptive execution failure messages and to determine which servers and services failed because of rule execution failure.
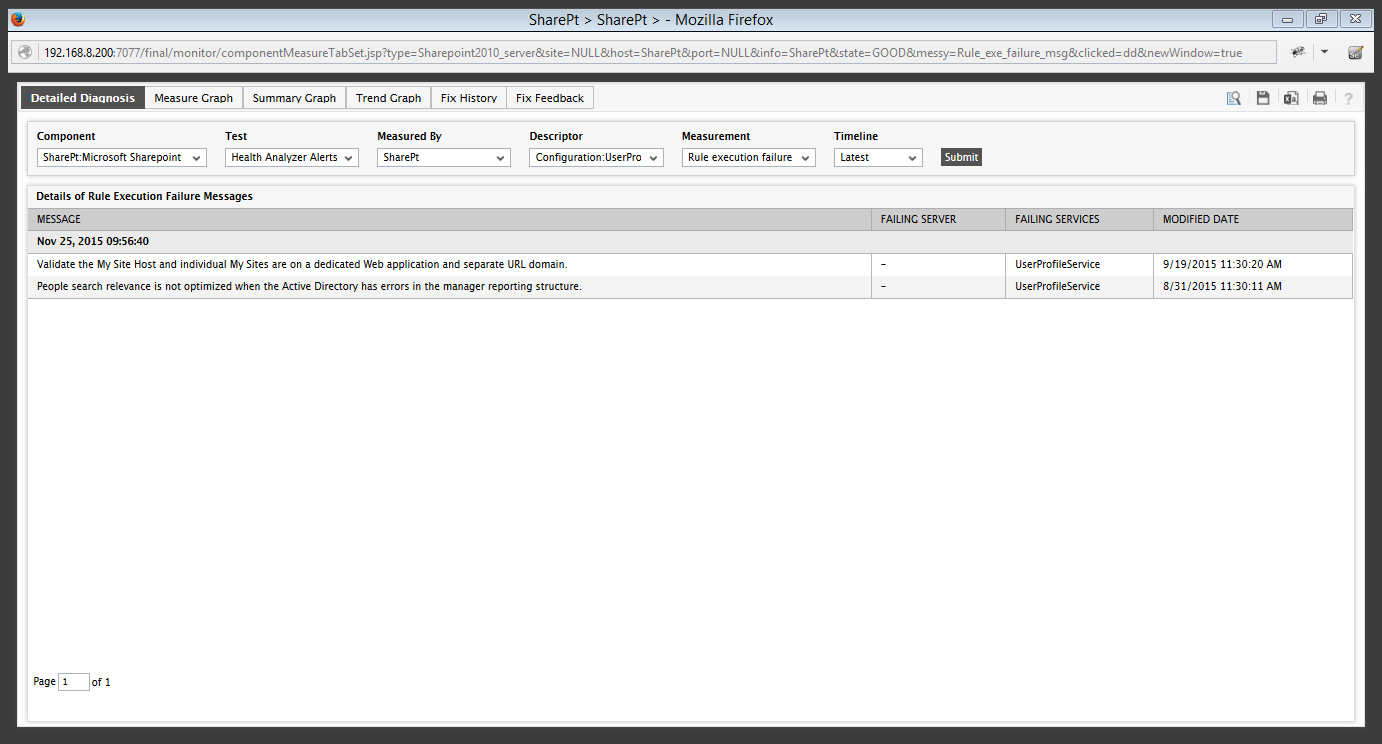
Figure 4 : The detailed diagnosis of the Rule execution failure messages measure