Site Usage Analytics Test
Enterprises typically use SharePoint to create web sites and web applications. The success of the SharePoint platform therefore hinges on how happy users are when interacting with the web sites that it helped create. If the number of visitors to a web site keeps increasing, it is indicative of an increase in the web site’s popularity, which directly translates into ‘many happy users’! Likewise, if users to a web site constantly complain of slowness when browsing that web site, it indicates that user experience with the web site is unsatisfactory – meaning, ‘many unhappy users’. This in turn can hit user productivity badly, escalate troubleshooting time and costs of the enterprise, and adversely impact its revenues and reputation! To improve user experience with SharePoint sites and to build user confidence in the SharePoint platform, administrators should be able to quickly identify slow web sites and precisely pinpoint the reason for the slowness.
This is where the Site Usage Analytics test helps! This test queries the SharePoint Logging database at configured intervals and collects metrics on web site usage that is stored therein – this includes the web sites accessed, count of hits to each web site, users who browsed every site, the browsers that were used for web site access, web pages requested, the time taken for the requested pages to load, where page views spent time and how much, error responses returned, resources consumed, and many more. For each web site configured for monitoring, the test then reports the average time taken by that site to load pages. In the process, the test points administrators to slow web sites and also leads them to the probable source of the slowness – is it owing to a latent web front end? is it because of slow service calls? Or is it due to inefficient queries to the backend database?
Sometimes, poor user experience can be attributed to HTTP errors. This is why, this test instantly alerts administrators to HTTP error responses, thus ensuring their timely intervention and rapid resolution of the error conditions.
This way, the Site Usage Analytics test enables administrators to detect web site slowness well before users notice, helps them promptly and accurately diagnose the source of the poor user experience with a web site, and thus ensures that they initiate measures to enhance user experience and pre-empt the damage that may be caused to revenue and reputation.
Note:
This test will run only if a SharePoint Usage and Health Service application is created and is configured to collect usage and health data. To know how to create and configure this application, follow the steps detailed in Configuring the eG Agent to Collect Usage Analytics.
Target of the test : A Microsoft SharePoint Server
Agent deploying the test : An internal/remote agent
Outputs of the test : One set of results for each Site configured for monitoring
| Parameters | Description |
|---|---|
|
Test period |
This indicates how often should the test be executed. |
|
Host |
The host for which the test is to be configured. |
|
Port |
The port at which the host server listens. |
|
SQL Port Number |
Specify the port number of the SQL server that hosts the SharePoint Logging database. |
|
Instance |
If the SQL server that hosts the SharePoint Logging database is instance-based, then provide the instance name here. If not, then set this to none. |
|
SSL |
If the SQL server hosting the SharePoint Logging database is SSL-enabled, then set this flag to Yes. If not, set it to No. |
|
Isntlmv2 |
In some Windows networks, NTLM (NT LAN Manager) may be enabled. NTLM is a suite of Microsoft security protocols that provides authentication, integrity, and confidentiality to users. NTLM version 2 (“NTLMv2”) was concocted to address the security issues present in NTLM. By default, the Isntlmv2 flag is set to No, indicating that NTLMv2 is not enabled by default on the SQL server that hosts the SharePoint Logging database. Set this flag to Yes if NTLMv2 is enabled on that SQL server. |
|
Database Domain |
Specify the fully qualified name of the domain in which the Microsoft SQL server hosting the SharePoint Logging database operates. For instance, your specification can be: SharePoint.eginnovations.com |
|
Database server Name |
Specify the name of Microsoft SQL server that hosts the SharePoint Logging database to be accessed by this test. |
|
Database Name |
Specify the name of the SharePoint Logging database that this test should access. |
|
Database User Name, Database Password, Confirm Password |
Specify the credentials of a user who has db_datareader access to the SharePoint Logging database configured, in the Database User Name and Database Password text boxes. Then, confirm the password by retyping it in the Confirm Password text box. |
|
Site |
Configure a comma-separated list of web site URLs that you want this test to monitor. For eg., http://www.msproject28rk2:11982,http://www.mydocs.com |
|
Slow Transaction Cutoff (ms) |
This test reports the count of slow page views and also pinpoints the pages that are slow. To determine whether/not a page is slow, this test uses the Slow Transaction Cutoff parameter. By default, this parameter is set to 4000 millisecs (i.e., 4 seconds). This means that, if a page takes more than 4 seconds to load, this test will consider that page as a slow page by default. You can increase or decrease this Slow Transaction Cutoff according to what is ‘slow’ and what is ‘normal’ in your environment. Note: The default value of this parameter is the same as the default Maximum threshold setting of the Avg page load time measure – i.e., both are set to 4000 millisecs by default. While the former helps eG to distinguish between slow and healthy page views for the purpose of providing detailed diagnosis, the latter tells eG when to generate an alarm on Avg page load time. For best results, it is recommended that both these settings are configured with the same value at all times. Therefore, if you change the value of one of these configurations, then make sure you update the value of the other as well. For instance, if the Slow Transaction Cutoff is changed to 6000 millisecs, change the Maximum Threshold of the Avg page load time measure to 6000 millisecs as well. |
|
URL patterns to be ignored from monitoring |
By default, this test does not track requests to the following URL patterns: *.js,*.css,*.jpeg,*.jpg,*.png,*.asmx,*.ashx,*.svc,*.dlll. If required, you can remove one/more patterns from this default list, so that such patterns are monitored, or can append more patterns to this list in order to exclude them from monitoring. For instance, to additionally ignore URLs that end with .gif and .bmp when monitoring, you need to alter the default specification as follows: *.js,*.css,*.jpeg,*.jpg,*.png,*.asmx,*.ashx,*.svc,*.dlll,*.gif,*.bmp |
|
Ignore AjaxDelta Pages |
By default, this test ignores all requests to AjaxDelta pages. This is why, the Ignore AjaxDelta Pages is set to Yes by default. If you want the test to track requests to the AjaxDelta pages as well, set this flag to No. |
|
Fetch Farm Measures |
Typically, farm-level metrics – eg., metrics on farm status, site collections, usage analytics – will not vary from one SharePoint server in the farm to another. If these metrics are collected and stored in the eG database for each monitored server in the SharePoint farm, it is bound to unnecessarily consume space in the database and increase processing overheads. To avoid this, farm-level metrics collection is by default switched off for the member servers in the SharePoint farm, and enabled only if the server being monitored is provisioned as the Central Administration site. Accordingly, this parameter is set to If Central Administration by default. This default setting ensures that farm-level metrics are collected from and stored in the database for only a single SharePoint server in the farm. If you want to completely switch-off farm-level metrics collection for a SharePoint farm, then set this parameter to No. Some high-security environments may not allow an eG agent to be deployed on the Central Administration site. Administrators of such environments may however require farm-level insights into status and performance. To provide these insights for such environments, you can optionally enable farm-level metrics collection from any monitored member server in the farm, even if that server is not provisioned as the Central Administration site. For this, set this parameter to Yes when configuring this test for that member server. |
|
Domain, Domain User, Password, and Confirm Password |
If the Fetch Farm Measures flag of these tests is set to No or to If Central Administration Site, then this test should be configured with the credentials of a user with the following privileges:
On the other hand, if the Fetch Farm Measures flag of these tests is set to Yes, then the user configured for the tests not only requires the four privileges discussed above, but should also be part of the following groups on the eG agent host:
It is recommended that you create a special user for this purpose and assign the aforesaid privileges to him/her. Once such a user is created, specify the domain to which that user belongs in the Domain text box, and then, enter the credentials of the user in the Domain User and Password text boxes. To confirm the password, retype it in the Confirm Password text box. |
|
DD Frequency |
Refers to the frequency with which detailed diagnosis measures are to be generated for this test. The default is 1:1. This indicates that, by default, detailed measures will be generated every time this test runs, and also every time the test detects a problem. You can modify this frequency, if you so desire. Also, if you intend to disable the detailed diagnosis capability for this test, you can do so by specifying none against DD frequency. |
|
Detailed Diagnosis |
To make diagnosis more efficient and accurate, the eG Enterprise embeds an optional detailed diagnostic capability. With this capability, the eG agents can be configured to run detailed, more elaborate tests as and when specific problems are detected. To enable the detailed diagnosis capability of this test for a particular server, choose the On option. To disable the capability, click on the Off option. The option to selectively enable/disable the detailed diagnosis capability will be available only if the following conditions are fulfilled:
|
| Measurement | Description | Measurement Unit | Interpretation |
|---|---|---|---|
|
Unique users |
Indicates the number of unique users of this web site. |
Number |
The detailed diagnosis of this measure reveals the names of the unique users and the number of requests from each user to the web site being monitored. From this, you can identify those users who are actively using the web site. |
|
Unique visitors |
Indicates the number of unique visitors to this web site. |
Number |
SharePoint authenticated users and anonymous users (using IP address) are counted as visitors. Compare the value of this measure across sites to identify the most popular SharePoint site. You can use the detailed diagnosis of this measure to know who are the unique visitors to the web site and the number of requests from each visitor to the web site. This way, you can identify that visitor who visits the web site most frequently. |
|
Unique destinations |
Indicates the number of unique destinations of this site. |
Number |
To know the most popular destination URLs of this site, use the detailed diagnosis of this measure. Here, you will find the top-10 destinations in terms of the number of hits. |
|
Unique browsers |
Indicates the number of unique browsers used for accessing this site. |
Number |
To know which browsers are commonly used to access this web site, use the detailed diagnosis of this measure. Here, the unique browsers will be listed and the number of hits to the web site from each browser will be displayed alongside, so that you can instantly identify that browser that has been widely used to access the web site. |
|
Unique referrers |
Indicates the number of unique URLs external to this site (parent site is treated as external as well), from where the users navigated to this site. |
Number |
To know which referrer URL was responsible for the maximum hits to this web site, use the detailed diagnosis of this measure. The top-10 unique referrer URLs in terms of the number of hits they generated will be displayed as part of the detailed diagnostics. |
|
Apdex score |
Indicates the Apdex score of this site. |
Number |
Apdex (Application Performance Index) is an open standard developed by an alliance of companies. It defines a standard method for reporting and comparing the performance of software applications in computing. Its purpose is to convert measurements into insights about user satisfaction, by specifying a uniform way to analyze and report on the degree to which measured performance meets user expectations. The Apdex method converts many measurements into one number on a uniform scale of 0-to-1 (0 = no users satisfied, 1 = all users satisfied). The resulting Apdex score is a numerical measure of user satisfaction with the performance of enterprise applications. This metric can be used to report on any source of end-user performance measurements for which a performance objective has been defined. The Apdex formula is: Apdext = (Satisfied Count + Tolerating Count / 2) / Total Samples This is nothing but the number of satisfied samples plus half of the tolerating samples plus none of the frustrated samples, divided by all the samples. A score of 1.0 means all responses were satisfactory. A score of 0.0 means none of the responses were satisfactory. Tolerating responses half satisfy a user. For example, if all responses are tolerating, then the Apdex score would be 0.50. Ideally therefore, the value of this measure should be 1.0. A value less than 1.0 indicates that the user experience with the web site has been less than satisfactory. |
|
Total page views |
Indicates the number of times the pages in this web site were viewed by users. |
Number |
This is a good measure of the traffic to your web site, and also reveals how popular your web site is. An unusually high number of page views could be a cause for concern, as it could be owing to a malicious virus attack or an unscrupulous attempt to hack your web site. Either way, be wary of sudden, but significant spikes in the page view count! |
|
Satisfied page views |
Indicates the number of times pages in this web site were viewed without any slowness. |
Number |
A page view is considered to be slow when the average time taken to load that page exceeds the slow transaction cutoff configured for this test. If this slow transaction cutoff is not exceeded, then the page view is deemed to be ‘satisfactory’. Ideally, the value of this measure should be high. If the value of this measure is much lesser than the value of the Tolerating page views and the Frustrated page views, it is a clear indicator that the experience of the users of this web site is below-par. In such a case, use the detailed diagnosis of the Tolerating page views and Frustrated page views measures to know which pages are slow. |
|
Tolerating page views |
Indicates the number of tolerating page views to this web site.
|
Number |
If the Average page load time of a page exceeds the slow transaction cutoff configuration of this test, but is less than 4 times the slow transaction cutoff (i.e., < 4 * slow transaction cutoff), then such a page view is considered to be a Tolerating page view. Ideally, the value of this measure should be 0. A value higher than that of the Satisfied page views measure is a cause for concern, as it implies that the overall user experience from this browser is less than satisfactory. To know which pages are contributing to this sub-par experience, use the detailed diagnosis of this measure. |
|
Frustrated page views |
Indicates the number of frustrated page views to this web site. |
Number |
If the Average page load time of a page is over 4 times the slow transaction cutoff configuration of this test (i.e., > 4 * slow transaction cutoff), then such a page view is considered to be a Frustrated page view. Ideally, the value of this measure should be 0. A value higher than that of the Satisfied page views measure is a cause for concern, as it implies that the experience of users using this browser has been less than satisfactory. To know which pages are contributing to this sub-par experience, use the detailed diagnosis of this measure. |
|
Average page load time |
Indicates the average time taken by the pages in this web site to load completely. |
Secs |
This is the average interval between the time that a user initiates a request and the completion of the page load of the response in the user's browser. If the value of this measure is consistently high for a web site, there is reason to worry. This is because, it implies that the web site is slow in responding to requests. If this condition is allowed to persist, it can adversely impact user experience with the web site. You may want to check the Apdex score in such circumstances to determine whether/not user experience has already been affected. Regardless, you should investigate the anomaly and quickly determine where the bottleneck lies – is it with the web front-end? is it owing to slow service calls? Or is it because of inefficient queries to the backend? - so that the problem can be fixed before users even notice any slowness! For that, you may want to compare the values of the Average service calls duration, Average CPU duration, Average IIS latency, and Average query duration measures of this test. |
|
Average service calls duration |
Indicates the time taken by this web site to generate service calls. |
Secs |
If the Avg page load time of a web site is abnormally high, then you can compare the value of this measure with that of the Web front-end processing time, Average CPU duration, Average IIS latency, and Average query duration measures of this test to know what exactly is delaying page loading – a slow front-end web server? inefficient queries to the backend database? or slow service calls? |
|
Average IIS latency |
Indicates the average time requests to this web site took in the frontend web server after the requests were received by the frontend web server but before this web site began processing the requests. |
Secs |
If the Avg page load time of a web site is abnormally high, then you can compare the value of this measure with that of the Average service calls duration, Average CPU duration, and Average query duration measures of this test to know what exactly is delaying page loading – a slow front-end web server? inefficient queries to the backend database? or slow service calls? |
|
Average CPU duration |
Indicates the average time for which requests to this web site used the CPU. |
Secs |
If the Avg page load time of a web site is abnormally high, then you can compare the value of this measure with that of the Average service calls duration, Average IIS latency, and Average query duration measures of this test to know what exactly is delaying page loading – a slow front-end web server? inefficient queries to the backend database? or slow service calls? |
|
SQL logical reads |
Indicates the total number of 8 kilobyte blocks that this web site read from storage on the back-end database server. |
Number |
|
|
Average CPU megacycles |
Indicates the average number of CPU mega cycles spent processing the requests to this web site in the client application on the front end web server. |
Number |
|
|
Total queries |
Indicates the total number of database queries generated for this site. |
Number |
|
|
Average query duration |
Indicates the average time taken for all backend database queries generated for this site. |
Secs |
If the Avg page load time of a web site is abnormally high, then you can compare the value of this measure with that of the Average service calls duration, Average IIS latency, and Average CPU duration measures of this test to know what exactly is delaying page loading – a slow front-end web server? inefficient queries to the backend database? or slow service calls? |
|
Average data consumed |
Indicates the average bytes of data downloaded by requests to this web site. |
KB |
|
|
GET requests |
Indicates the number of GET requests to this web site. |
Number |
|
|
POST requests |
Indicates the number of POST requests to this web site. |
Number |
|
|
OPTION requests |
Indicates the number of OPTION request to this web site. |
Number |
|
|
300 responses |
Indicates the number of responses to requests to this web site with a status code in the 300-399 range |
Number |
300 responses could indicate page caching on the client browsers. Alternatively 300 responses could also indicate redirection of requests. A sudden change in this value could indicate a problem condition. |
|
400 errors |
Indicates the number responses to requests to this web site that had a status code in the range 400-499. |
Number |
A high value indicates a number of missing/error pages. Use the detailed diagnosis of this measure to know when each of the 400 errors occurred, which user experienced the error, when using what browser, from which machine. This information will greatly aid troubleshooting. |
|
500 errors |
Indicates the number of responses to the requests to this web site that had a status code in the range 500-599. |
Number |
Since responses with a status code of 500-600 indicate server side processing errors, a high value reflects an error condition. Use the detailed diagnosis of this measure to know when each of the 500 errors occurred, which user experienced the error, when using what browser, from which machine. This information will greatly aid troubleshooting. |
The detailed diagnosis of the Unique users measure reveals the names of the unique users and the number of requests from each user to the web site being monitored. From this, you can identify those users who are actively using the web site.
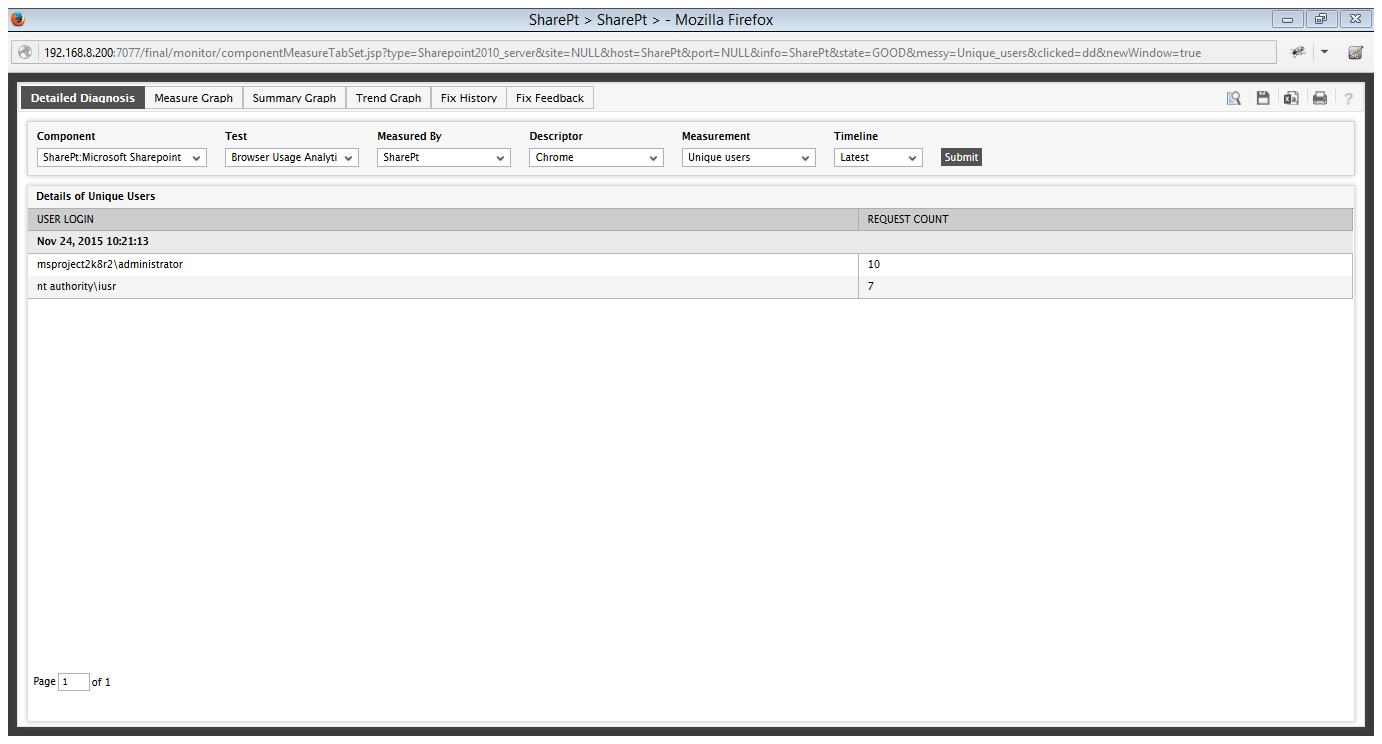
Figure 1 : The detailed diagnosis of the Unique users measure
You can use the detailed diagnosis of the Unique visitorsmeasure to know who are the unique visitors to the web site and the number of requests from each visitor to the web site. This way, you can identify that visitor who visits the web site most frequently.
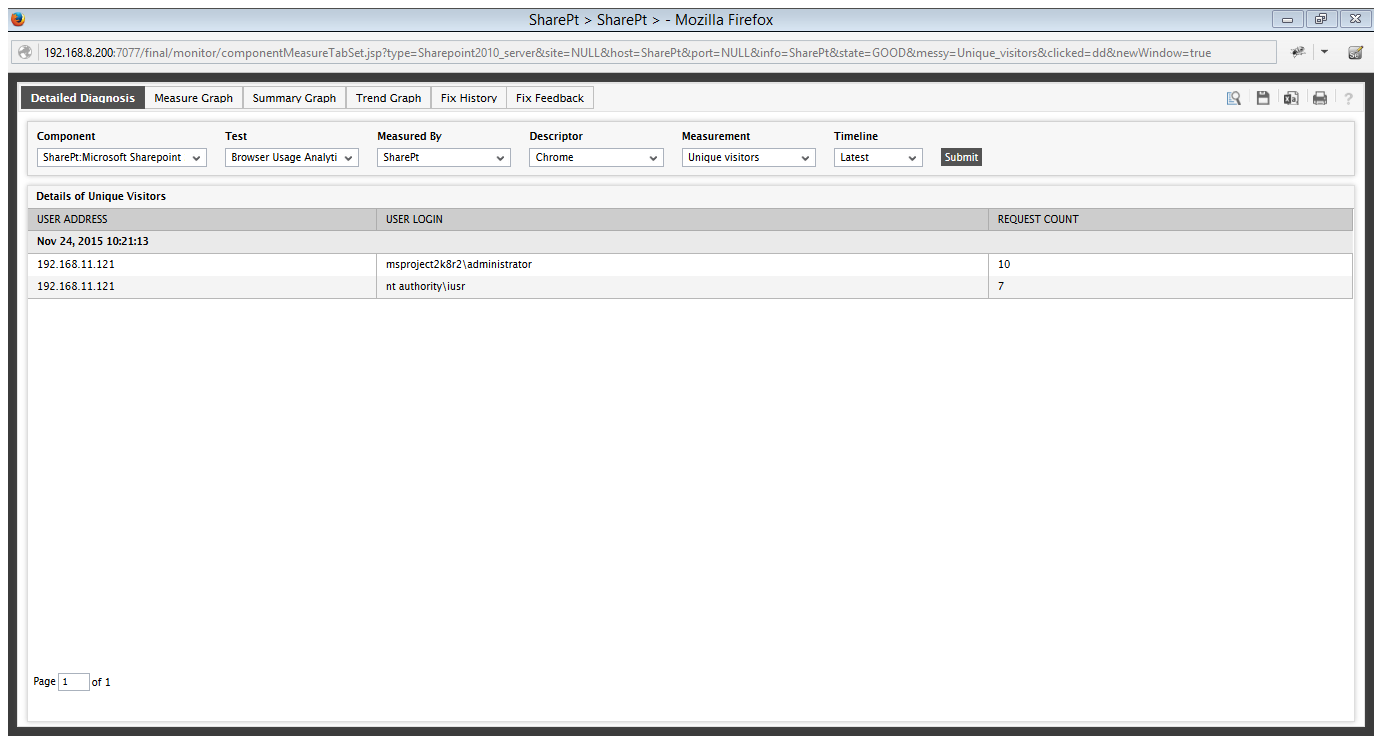
Figure 2 : The detailed diagnosis of the Unique visitors measure
To know the most popular destination URLs of this site, use the detailed diagnosis of the Unique destinations measure. Here, you will find the top-10 destinations in terms of the number of hits.
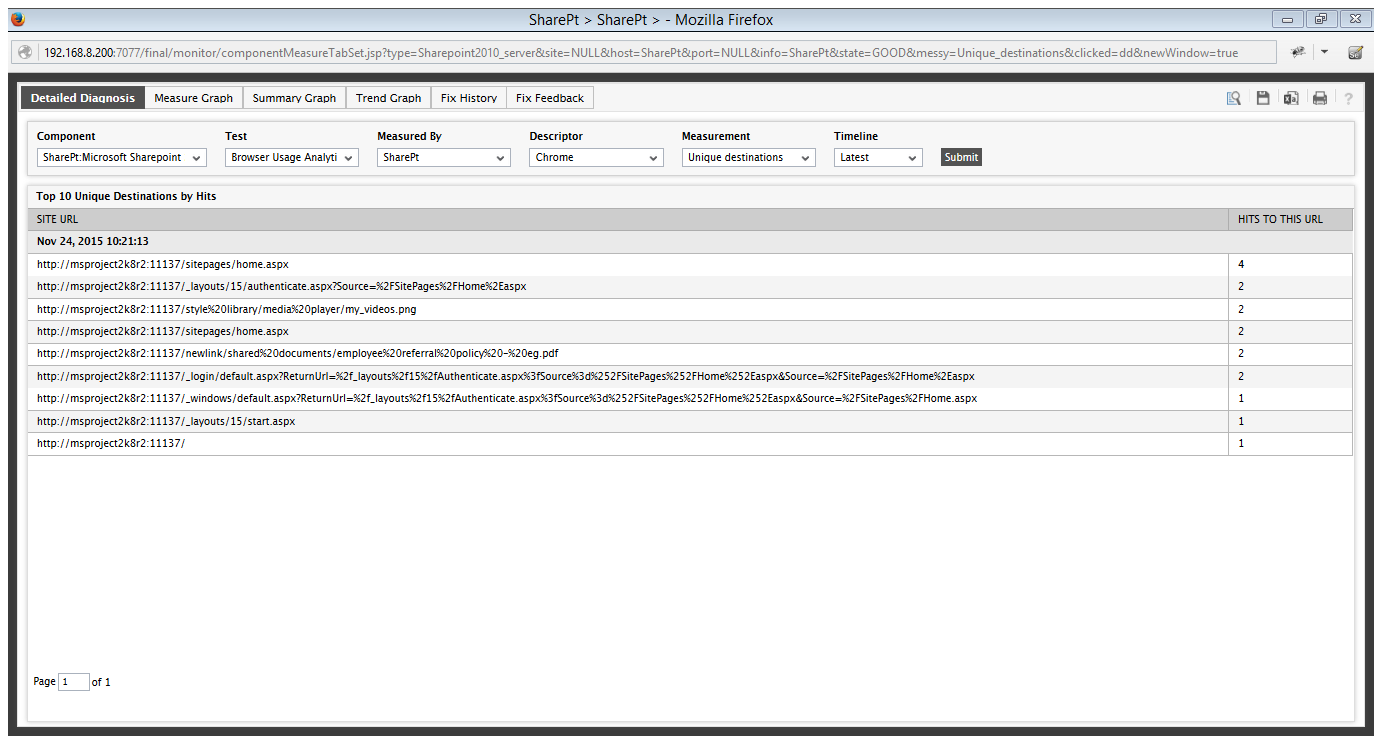
Figure 3 : The detailed diagnosis of the Unique destinations measure
To know which referrer URL was responsible for the maximum hits to this web site, use the detailed diagnosis of the Unique referrers measure. The top-10 unique referrer URLs in terms of the number of hits they generated will be displayed as part of the detailed diagnostics.
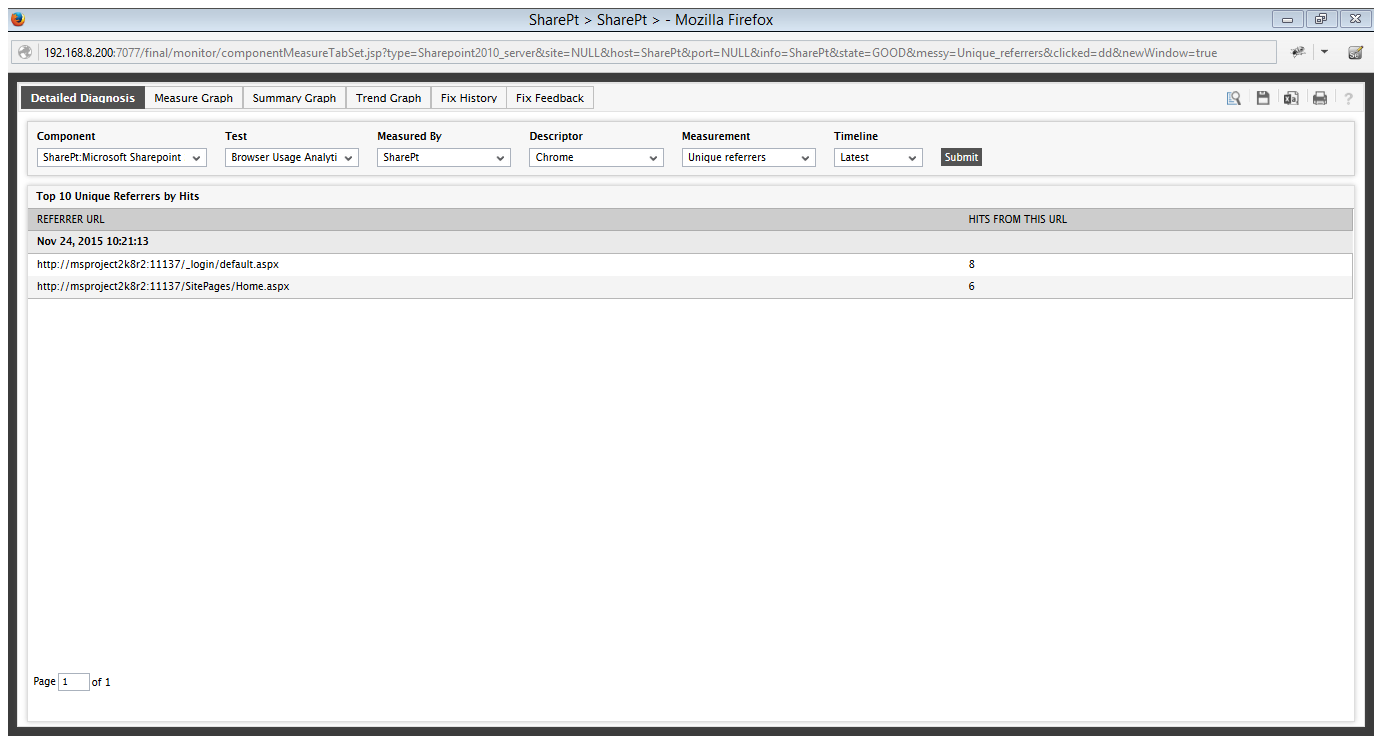
Figure 4 : The detailed diagnosis of the Unique referrers measure
If the Tolerating page viewsmeasure reports a non-zero value, then use the detailed diagnosis of this measure to view the top-10 pages in terms of page load time. From the detailed metrics, you can rapidly identify the URL of the page that took the longest to load, the load time of that page, when the slowness occurred, and which user’s access was impacted by the slowness. Additionally, usage analytics such as the count of requests to the slow page, the count of queries run by the page, the amount of data consumed, and the status of the HTTP access to the page are also revealed as part of the detailed diagnosis.
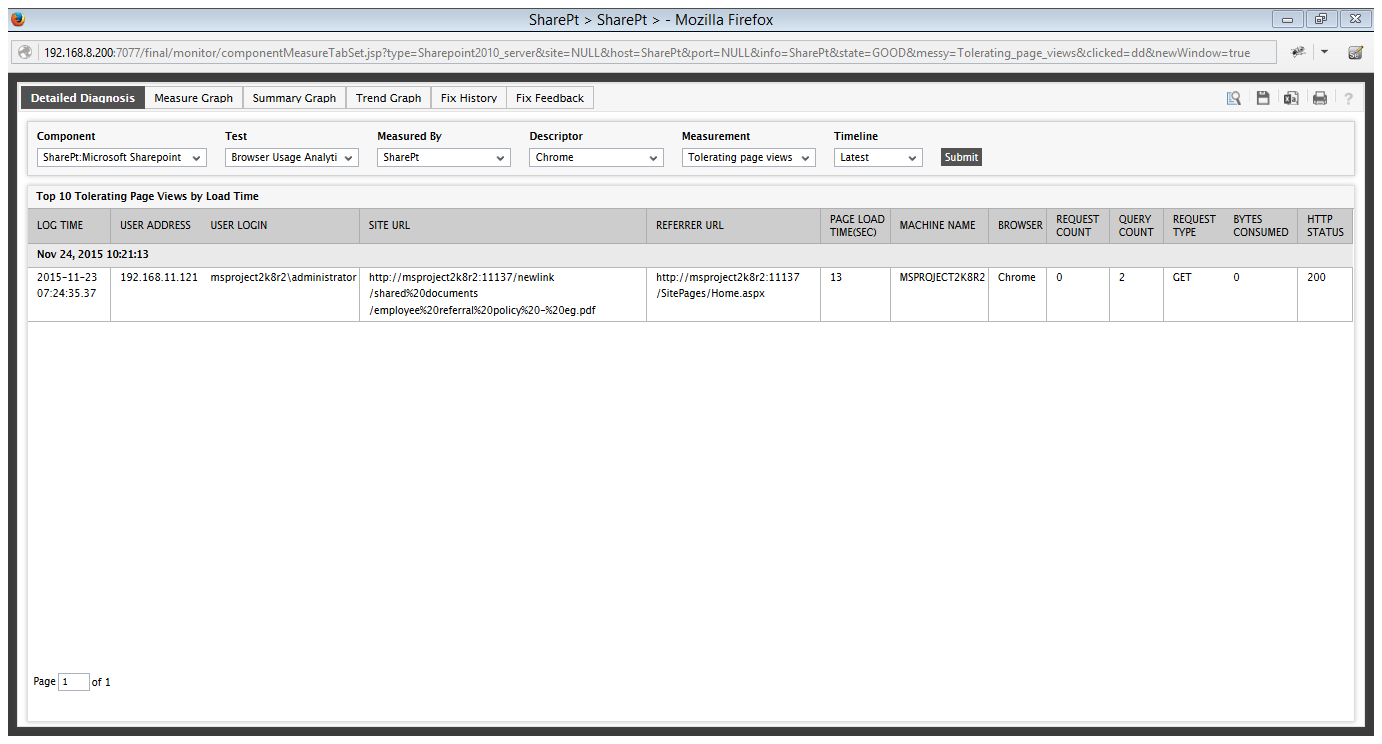
Figure 5 : The detailed diagnosis of the Tolerating page views measure
If the Frustrated page views measure reports a non-zero value, then use the detailed diagnosis of this measure to view the top-10 pages in terms of page load time. From the detailed metrics, you can rapidly identify the URL of the page that took the longest to load, the load time of that page, when the slowness occurred, and which user’s access was impacted by the slowness. Additionally, usage analytics such as the count of requests to the slow page, the count of queries run by the page, the amount of data consumed, and the status of the HTTP access to the page are also revealed as part of the detailed diagnosis.
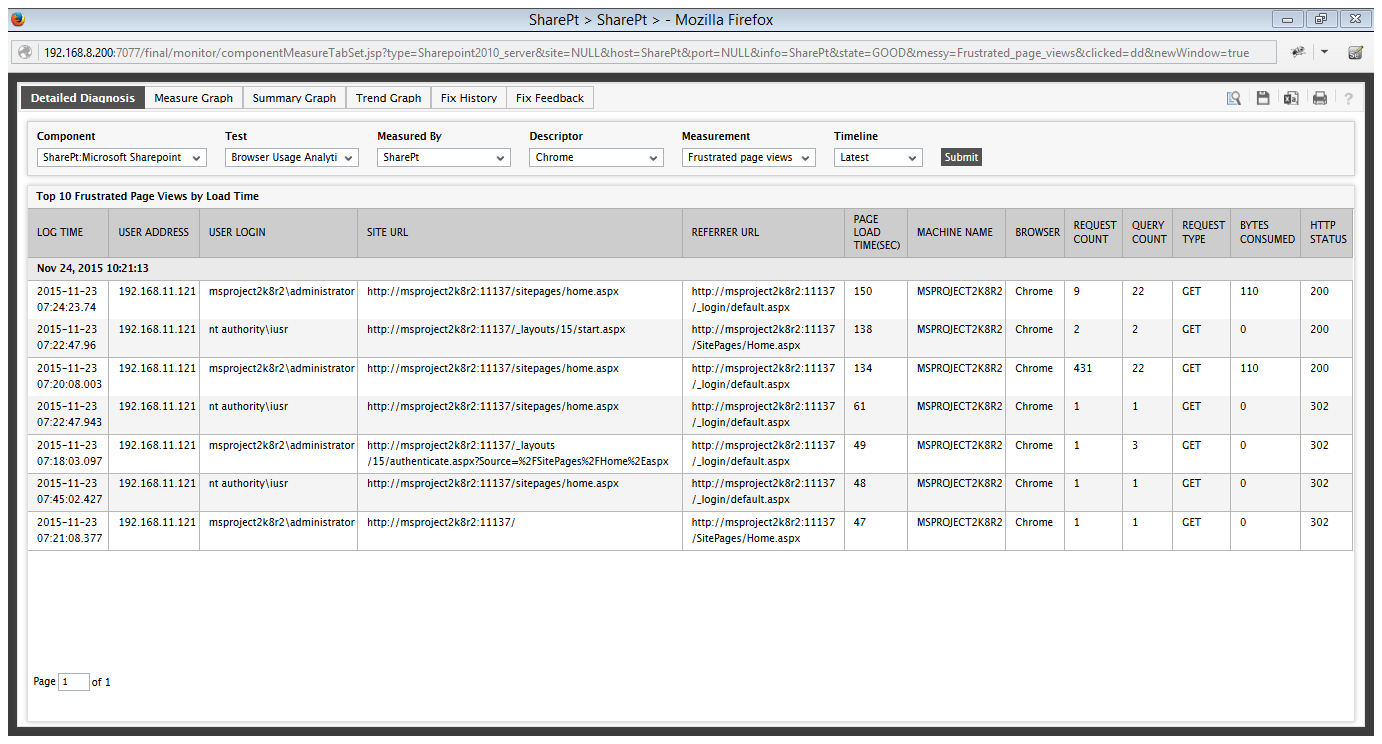
Figure 6 : The detailed diagnosis of the Frustrated page views measure
Use the detailed diagnosis of the 400 errors and 500 errorsmeasures to know when each of the 400 or 500 errors (as the case may be) occurred, which user experienced the error, when, using what browser, from which machine. This information will greatly aid troubleshooting.
![eG monitor - v6.1.0 - [admin :http://192.168.8.200:7077] - Mozilla Firefox](../Resources/Images/Microsoft-Sharepoint/Site-Usage-Analytics-Test-6.png)
Figure 7 : The detailed diagnosis of the 400 errors measure
![eG monitor - v6.1.0 - [admin :http://192.168.8.200:7077] - Mozilla Firefox](../Resources/Images/Microsoft-Sharepoint/Site-Usage-Analytics-Test-7.png)
Figure 8 : The detailed diagnosis of the 500 errors measure
Configuring the eG Agent to Collect Usage Analytics
SharePoint Usage and Health Service application is a feature to analyze usage of SharePoint environment or troubleshooting SharePoint Issues. This application can be configured to collect two types of data: Usage data and Health data. The following tests use the Usage data collected by the application to report metrics:
- Site Usage Analytics test
- Web Application Usage Analytics test
- Browser Usage Analytics test
- User Analytics test
- Distributed Cache Usage Analytics test
Usage data is about usage on SharePoint Farm, like page requests, feature use, search query latency, etc. This data is similar to IIS log, however unlike IIS logs this has additional SharePoint specific data collected like Application ID, Site ID, Web ID, Correlation ID etc. Usage data is initially stored in Usage Log file (.USAGE ) on SharePoint Server under logging directory which is later processed by Microsoft SharePoint Foundation Usage Data Import Timer job into SharePoint Logging database. Each of the tests above query the SharePoint Logging database at configured intervals to collect the metrics they require.
For these tests to run, the following pre-requisites should be fulfilled:
- A SharePoint Usage and Health Service Application should be created on the target SharePoint server;
- Usage and Health data collection should be enabled for this application
- The eG agent on the SharePoint server should be allowed to query the SharePoint Logging database.
Each of these steps are detailed below.
Creating a SharePoint Usage and Health Service Application
For this, do the following:
- Login to the target SharePoint server as a user with Farm administrator privileges.
- Open the SharePoint management shell.
-
Then, run the following commands one after another:
Add-PSSnapin Microsoft.SharePoint.PowerShell
New-SPUsageApplication -Name "<Name_of_application>"
For example, your command can be:
Add-PSSnapin Microsoft.SharePoint.PowerShell
New-SPUsageApplication -Name "SharePointUsageApp"
If the command executes successfully, then your output will reveal the name of the application you created, the application type, and the application ID.
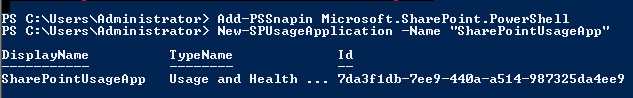
Figure 9 : Output of the command issued for creating a SharePoint Usage and Health application
-
Next, open the SharePoint management console and follow the node sequence, Central Administration -> Application Management -> Manage service applications, on the console. Figure 10 will then appear. Click the Manage service applications option under Service Applications in Figure 10.
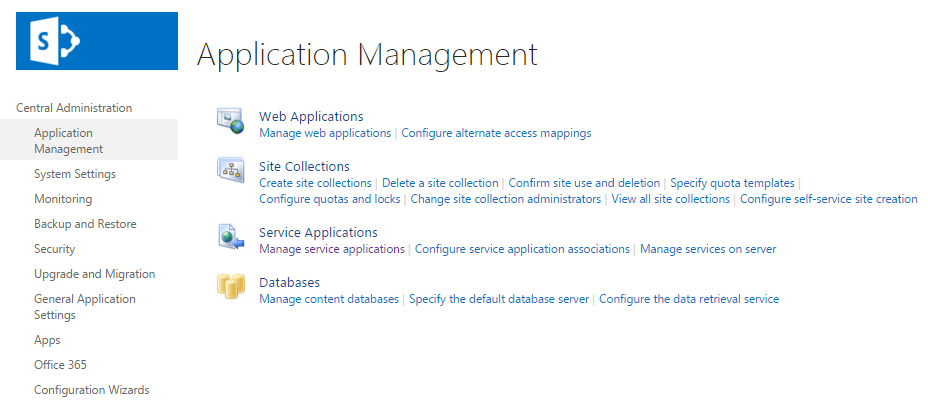
Figure 10 : Selecting the Manage service applications option
-
When Figure 11 appears, look for an entry for the new Usage and Health application you created at step 3 above. If its available therein, it is a clear indicator that the new application has been created successfully.
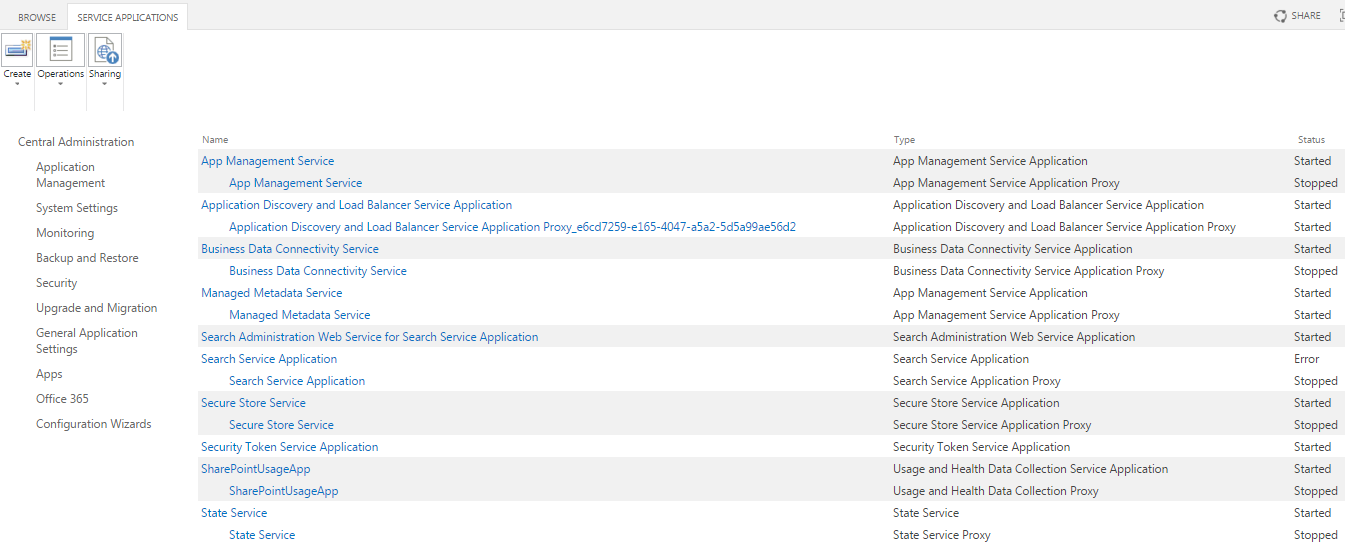
Figure 11 : Looking for an entry for the new Usage and Health application you created
Enabling Usage and Health Data Collection
To achieve this, follow the steps below:
-
In the SharePoint management console, select the Monitoring node under Central Administration. Then, click on the Configure usage and health data collection option under Reporting (see Figure 12).
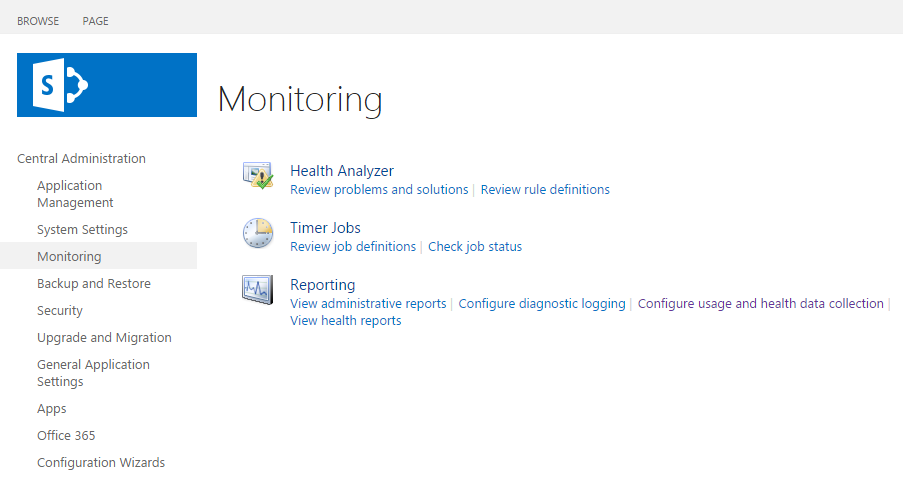
Figure 12 : Selecting the Configure usage and health data collection option
-
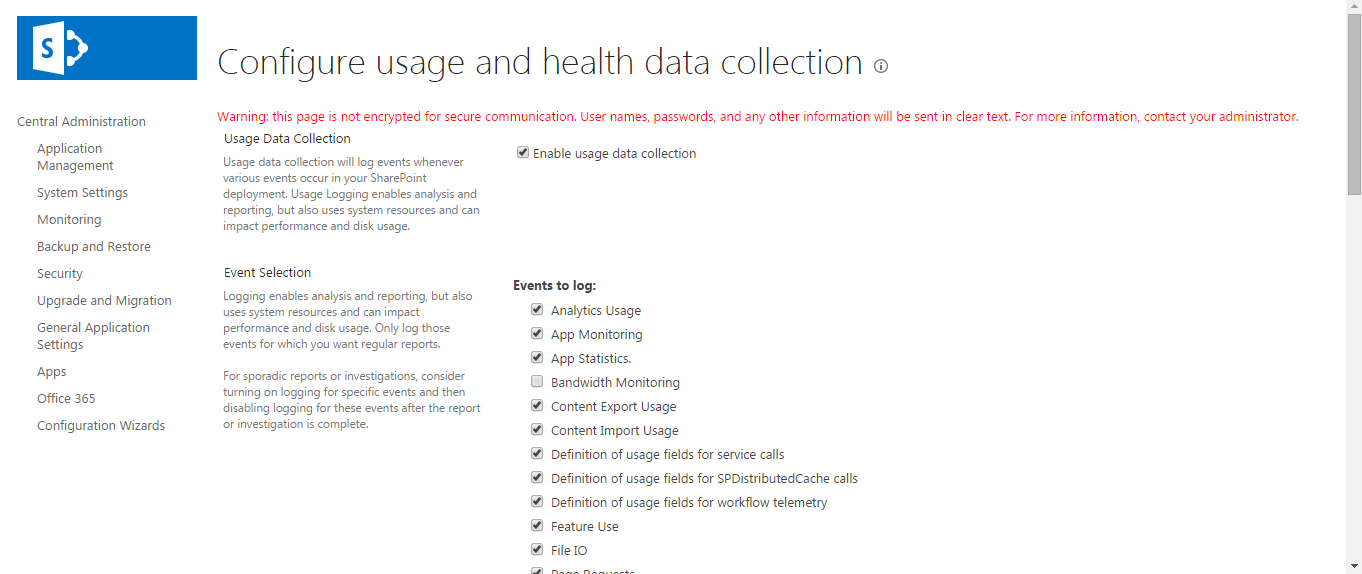
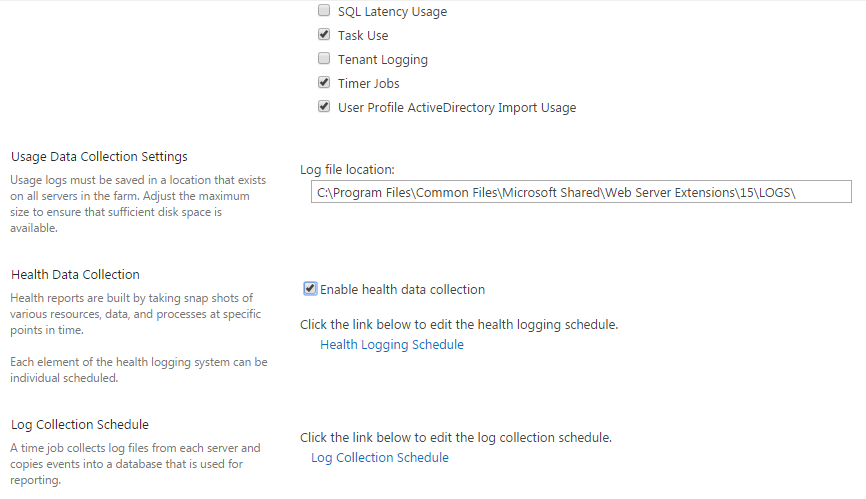
When Figure 13 appears, select the Enable usage data collection checkbox therein.
-
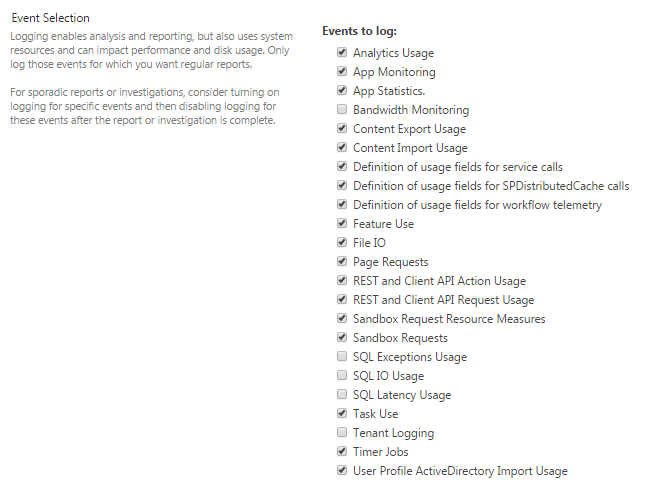
Under the Events to log section, make sure that the default selections (indicated by Figure 14 and Figure 15) are not disturbed.
-
Scroll down Figure 18.13 and then select the Enable health data collection check box that becomes visible.
-
Scroll further down Figure 15 until the Database Server and the Database Name fields visible (see Figure 16). Copy the values of these fields to a text editor. Make sure that the database server and database name parameters of the analytics tests are configured with the copied values only.
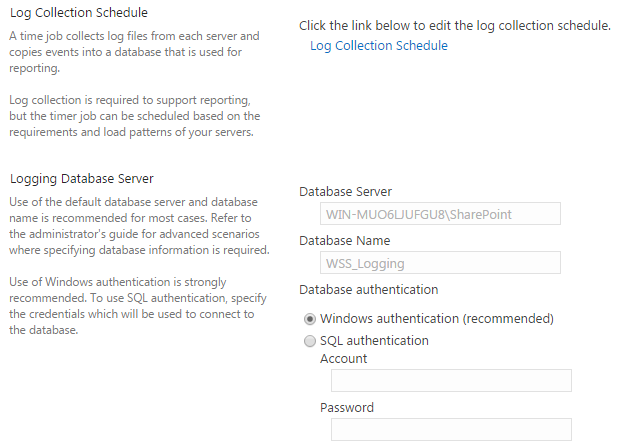
Figure 16 : The name of the SQL server hosting the SharePoint Logging database and the name of the SharePoint Logging database