Performance Rating
Viewing the Measure Value of a Performance Rating test
Once the Performance Rating test has been configured in the eG administrative interface, navigate to the layer model of the components of the component type that you have associated with your Performance Rating test. Clicking on the layer that you have associated with your Performance Rating test, will reveal the tests associated with the layer along with the Performance Rating test. Clicking on your Performance Rating test will reveal the Measurements panel where all the metrics collected by the test will be displayed (see Figure 1).
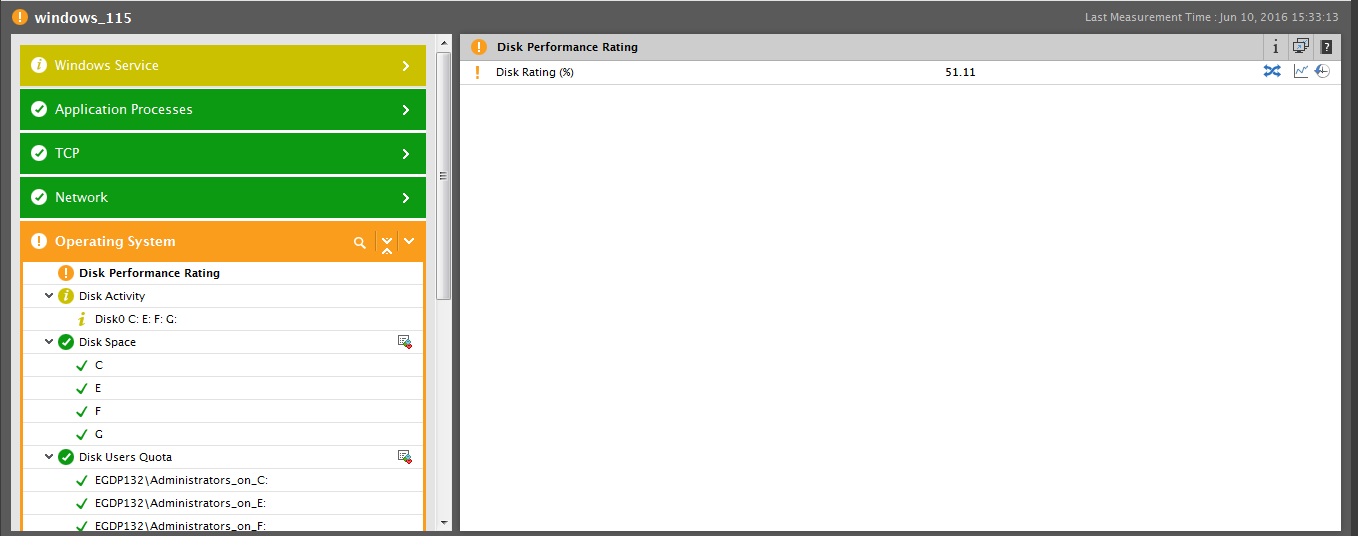
Figure 1 : The Performance Rating test showing the overall performance of the disks on a Microsoft Windows server
Clicking on the measure will open Figure 2 which displays the alarm that is configured for the measure during measure configuration. To know how to configure the measure, refer to the Administering the eG Enterprise.
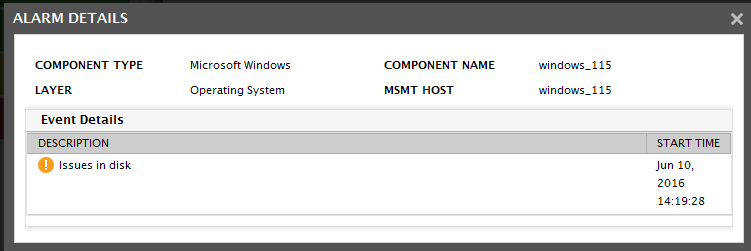
Figure 2 : The Alarm details for the Disk Rating measure
The Measurements panel in Figure 1 not only displays the values of the metrics, but also indicates how the values are derived. To know how the Measure value of the Disk Rating measure (see Figure 1) is calculated, click the  icon. Figure 3 will then appear.
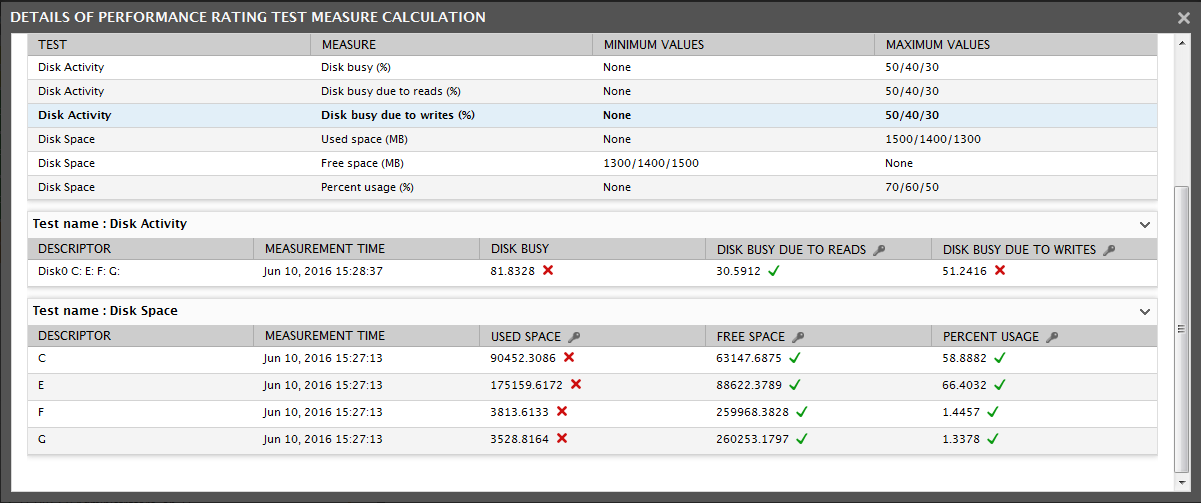
Figure 3 : The calculation of the Disk Rating measure
Now, let us proceed to understand how the Measure Value for the Disk Rating measure is calculated. The major steps that are followed while computing the Measure Value of the Performance Rating test are:
- Obtain the actual value of each measure that is grouped together to form the measure of the Performance Rating test.
- Compare this actual value with the Maximum Values/Minimum Values that are set for each measure.
- Check if the measure is a key/non-key measure.
- Apply the weightage for each measure based on the values specified for System-defined/Custom-defined weightages.
- Compute the Measure Value by adding all the weightages and deducing the percentage.
Non-descriptor based Performance Rating computation
Since the Disk Performance Rating test in Figure 1 is not a descriptor based test and the Weightage applied is System defined, the weightage for both the key measures and the non-key measures are the same. The Associated TESTS AND MEASURES section in Figure 3 shows the measures that are grouped together for the Disk Rating measure. The Minimum Values/Maximum Values that you configured are also specified against each measure. The table below will explain the weightage awarded to each measure grouped under the Disk Rating measure. By default, the System defined weightage is: Normal-3 Minor-2 Major-1 Critical-0.
| Test | Descriptor | Measure | Actual Value | Is this a violation (Y/N) | Value violated | Weightage assigned | Overall health score |
|---|---|---|---|---|---|---|---|
| Disk Activity | Disk0 C:E:F:G | Disk busy | 81.8328 | Y | Maximum Critical | 0 | 2/9 |
| Disk busy due to reads | 30.5912 | Y | Maximum Minor | 2 | |||
| Disk busy due to writes | 51.2416 | Y | Maximum Critical | 0 | |||
| Disk Space
|
C |
Used Space | 90452.3086 | Y | Maximum Critical | 0 | 5/9 |
| Free Space | 63147.6875 | N | - | 3 | |||
| Percent Usage | 58.8882 | Y | Maximum Minor | 2 | |||
|
E |
Used Space | 75159.6172 | Y | Maximum Critical | 0 | 4/9 | |
| Free Space | 88622.3789 | N | - | 3 | |||
| Percent Usage | 66.4032 | Y | Maximum Major | 1 | |||
| F | Used Space | 3813.6133 | Y | Maximum Critical | 0 | 6/9 | |
| Free Space | 259968.3828 | N | - | 3 | |||
| Percent Usage | 1.4457 | N | - | 3 | |||
| G
|
Used Space | 3528.8164 | Y | Maximum Critical | 0 | 6/9
|
|
| Free Space | 260253.1797 | N | - | 3 | |||
| Percent Usage | 1.3378 | N | - | 3 | |||
|
Measure Value of the Disk Rating measure is (2/9+5/9+4/9+6/9+6/9)*100 which is 51.11% |
|||||||
Note:
The state of the Disk Rating measure is governed by the default threshold values set by the eG Enterprise.
For example, let us take the Disk Busy measure in Figure 3. The actual value reported by this measure in the Disk Activity test is 81.8328%. The Disk Busy measure is configured as a non-key measure with the Maximum Values set to 50/40/30 (Critical/Major/Minor). Comparing the actual value 81.8328 with the set Maximum Values clearly indicates that the actual value has violated the Critical value that is set in the Maximum Values. When a system -defined weightage value is applied, the maximum weightage value that can be awarded for a measure is 1, by default(this is the normal weightage value). Now, since the Disk Busy measure has violated the critical value, the actual weightage value that needs to be awarded for this measure is 0 for a overall score of 1. Therefore, the icon is displayed against the Disk Busy measure value, and the weightage awarded for this measure is 0/1.
By actually comparing all the actual values with the Maximum Values/Minimum Values and awarding the weightage values in Figure 3, you will get the following:
Disk Activity test: 0/3+2/3+0/3 which is 2/9
Disk Space test: 0/3+2/3+3/3+0/3+3/3+1/3+0/3+3/3+3/3+0/3+3/3+3/3 which is 21/36
Finding out the percentage value for 2/9+21/36 gives you 51.11 as the Measure Value for your Disk Rating measure.
Descriptor based Performance Rating computation
Except for the calculation, the steps involved in monitoring a non-descriptor Performance Rating test and a descriptor based Performance Rating test are the same. Let us now take an example of User Experience Rating test whose descriptors are derived from Citrix XA Users test. The User experience measure displays the overall user experience based on certain key metrics.
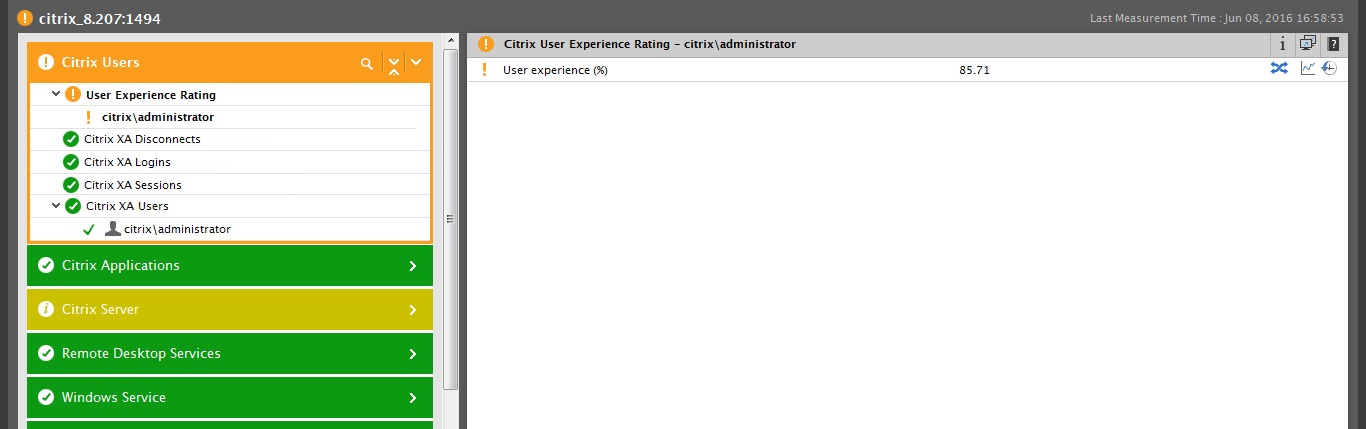
Figure 4 : The overall user experience of a user logging into a XenApp server
By merely looking at Figure 4, administrators can easily identify the overall experience of the citrix/administrator user.
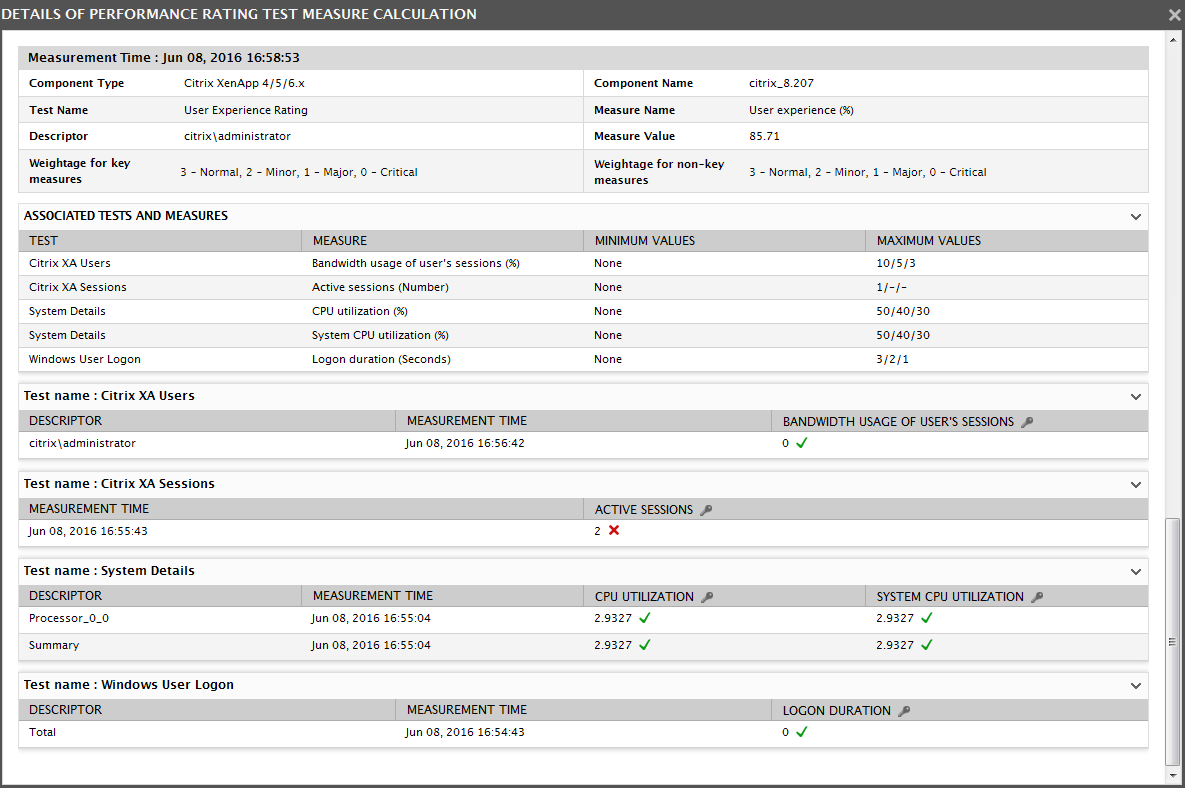
Figure 5 : The calculation of the User Experience measure
The table below will explain in detail on how the User Experience measure is computed for the citrix\administrator user.
| Test | Descriptor | Measure | Actual Value | Is this a violation (Y/N) | Value violated | Weightage assigned | Overall health score |
|---|---|---|---|---|---|---|---|
| Citrix XA Users | citrix\administator | Bandwidth usage of user's sessions | 0 | N | - | 3 | 3/3 |
|
Citrix XA Sessions
|
- |
Active Sessions | 2 | Y | Maximum Critical | 0 | 0/3 |
| System Details | Processor_0_0 | CPU Utilization | 2.9327 | N | - | 3 | 6/6 |
| System CPU Utilization | 2.9327 | N | - | 3 | |||
| Summary | CPU Utilization | 2.9327 | N | - | 3 | 6/6 | |
| System CPU Utilization | 2.9327 | N | - | 3 | |||
| Windows User Logon | Total | Logon Duration | 0 | N | - | 3 | 3/3 |
|
Measure Value of the Disk Rating measure is (3/3+0/3+6/6+6/6+3/3)*100 which is 85.71% |
|||||||
There are 4 different cases that should be taken into account while calculating the measure value of the descriptor based Performance Rating test. They are:
- The descriptors of the Performance Rating test exactly matches with the descriptors of the tests contributing the measures to the Performance Rating test;
- Atleast one descriptor of the Performance Rating test matches with the descriptors of the tests contributing the measures to the Performance Rating test;
- The descriptors of the Performance Rating test do not match with the descriptors of the tests contributing the measures to the Performance Rating test;
- The tests contributing the measures to the Performance Rating test are non-descriptor based;