Virtual Machines Dashboard
Large virtual environments are typically characterized by hundreds of virtual hosts, with tens of VMs configured on each host. In such environments, if a mission-critical application executing on a VM experiences a slowdown, the key challenge for the administrator is to determine what caused the slowdown - is it because the VM was powered off? is it owing to a resource contention at the VM? Is it slow in processing I/O?
eG Enterprise offers dedicated monitoring models for a multitude of virtualization platforms to enable administrators to address the performance concerns cited above. By analyzing the resource usage of VMs from inside, and using an intelligent correlation engine to differentiate problem symptoms from sources, these models accurately point to the root-cause of slowdowns experienced by a virtual application. In addition, these models are also capable of tracking the movement of VMs from one host to another and alerting administrators to the same. However, the key limitation of these models is that the aforesaid capabilities are 'hidden' inside the layers, tests, and measures offered by the models. To bring these capabilities to light, administrators would have to invest a considerable amount of time and mouse clicks!
To instantly identify these issues, eG Enterprise offers a quicker, 'single glance' Virtual Machines dashboard. This dashboard provides administrators of virtualized environments the wherewithal to accurately diagnose the cause for slowdowns experienced by a virtual application, with minimal effort and time! This dashboard collates critical resource usage data from 'inside' of all the VMs on a virtual server, presents them in tabulated formats in a single interface in the eG monitoring console, and thus aids instant and effective performance analysis.
In the event of a problem situation therefore, administrators can use the Virtual Machines dashboard to rapidly find answers to the following questions:
-
How are the VMs using the physical resources of the host? Is any VM consuming resources excessively? If so, which VM is it?
-
Which VM is utilizing maximum bandwidth?
-
Which are those VMs that are I/O intensive?
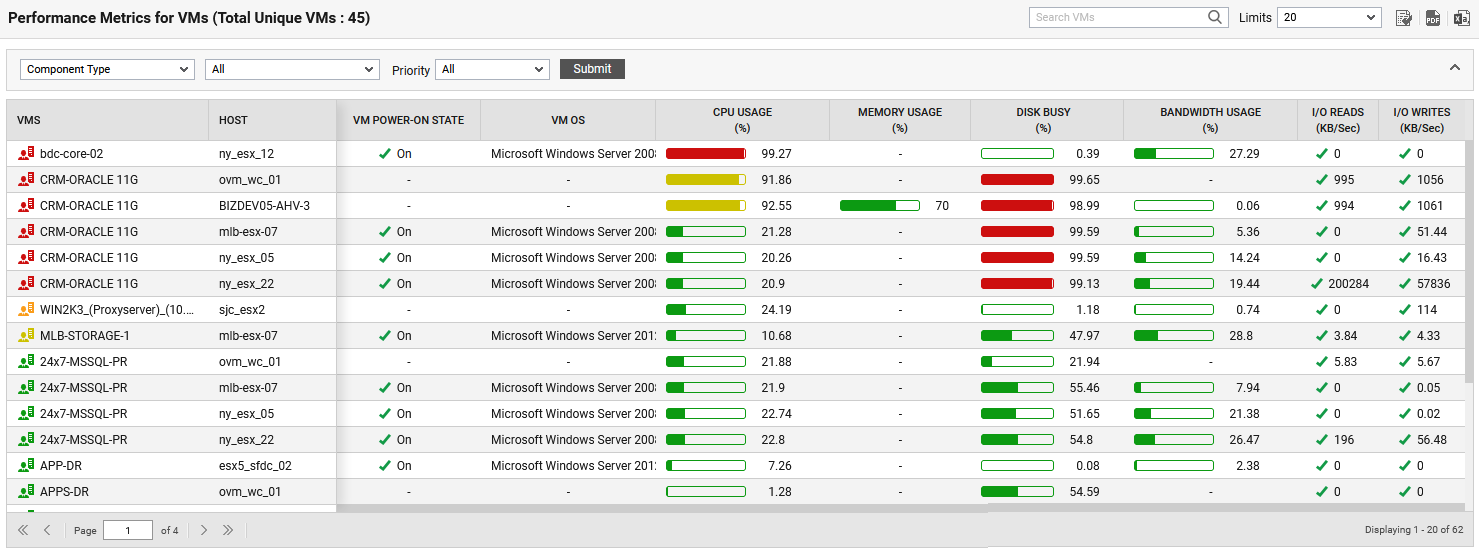
Figure 1 : The Virtual Machines Dashboard
By default, this dashboard displays all virtual machines within the target environment based on the component types. To this effect, Component Type option is chosen by default, and All option is chosen from the list adjacent to the Component Type list (see Figure 1). Also, you can filter the Virtual Machines based on their alarm priority. By default, All option is chosen from the Priority list (see Figure 1).
If you wish to filter the Virtual Machines based on the components belonging to a Zone/Service/Segment, then, pick the Zone/Service/Segment option and the zone/service/segment of your choice from the list and click the Submit button. Figure 2 displays the virtual machines that are within the components associated with a segment.
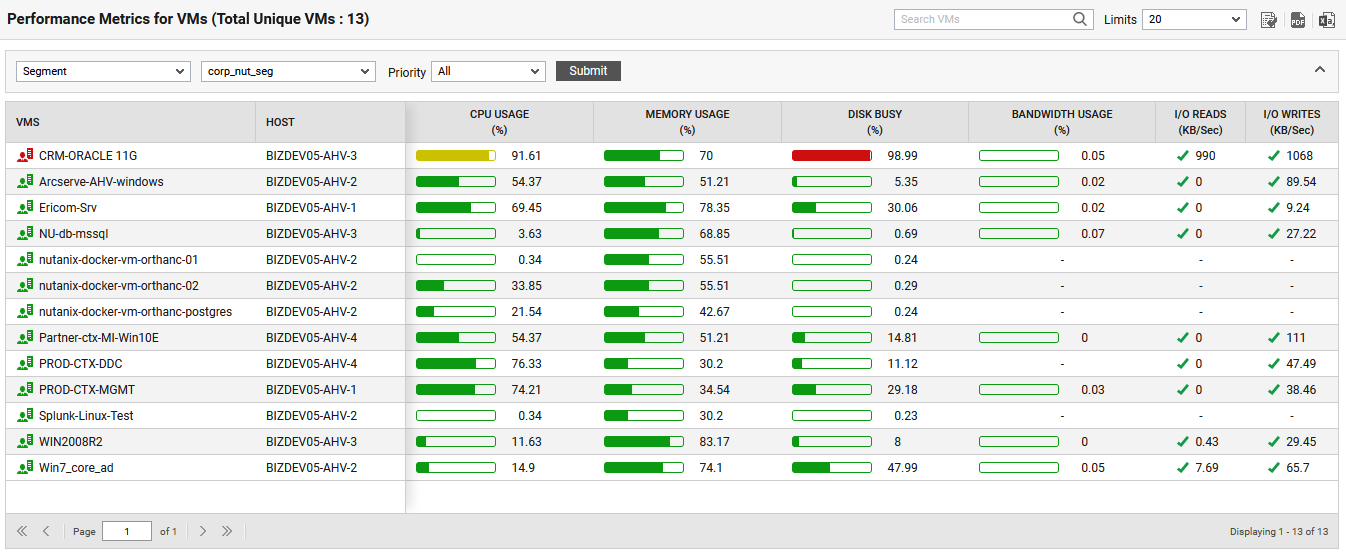
Figure 2 : Filtering the Virtual Machines based on a Segment
If you wish to view the list of virtual machines based on an alarm priority i.e., alarms raised for any inside view measure of the virtual machines, choose any one of the Critical/Major/Minor/Normal options from the Priority list box. Figure 3 displays filtering the Virtual machines based on Critical alarm priority. By default, All option will be chosen against this list.
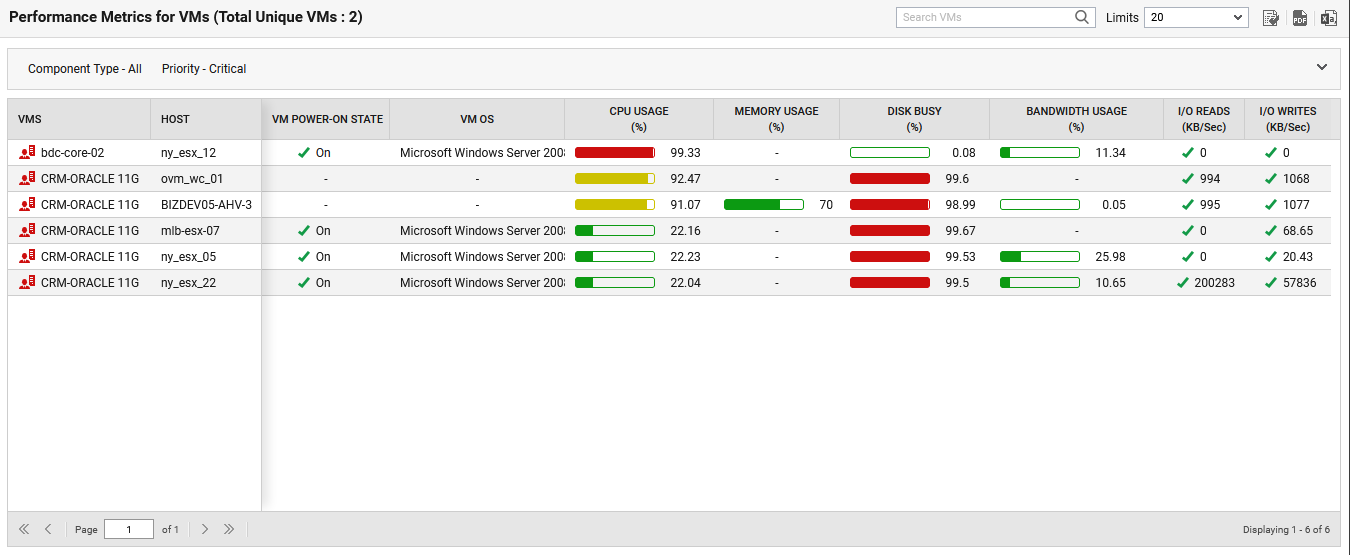
Figure 3 : Filtering the Virtual Machines based on Critical alarm priority
If you wish to search for a particular VM, then you can use the Search VMs text box. You can specify the exact name of the VM or partial name or even use a pattern to search for the VMs of your choice and click the ![]() icon.
icon.
By default, 20 VMs are listed in a single page. If you wish to alter this default setting and view the resultant VMs based on the count of your choice, then you can pick an option from the Limits list. You can choose to display as small as 5 VMs per page to as large as 500 VMs per page.
You can customize the Virtual Machines Dashboard to include additional measures of your choice. For this, click the ![]() icon to the right, top corner of the dashboard (see ). will then appear.
icon to the right, top corner of the dashboard (see ). will then appear.
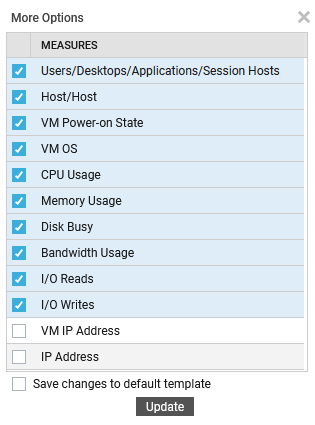
Figure 4 : Adding additional measures to the Virtual Machines dashboard
By default, a few measures are already chosen indicating that the default Virtual Machines dashboard lists those measures for each VM by default. Choosing the measures of your choice from Figure 4 and clicking the Update button will ensure that those measures are displayed in a separate column in the Virtual Machines dashboard. If you wish to save the changes that you made to the default Virtual Machines dashboard template, then, you can do so by checking the check box preceding the Save changes to default template option.
In addition to the measures displayed in Figure 4, if you wish to add one/more measures of your choice to the Virtual Machines dashboard, then, you can do so using the CONFIGURED MEASURES page that appears when you navigate through the menu sequence: MONITOR SETTINGS -> Virtualization -> Virtual Machines Dashboard -> Configured Measures in the eG admin interface. Prior to this navigate through the Admin -> Settings -> Monitor menu sequence.
You can even save this page as a PDF file by clicking the ![]() icon or as a CSV file by clicking the
icon or as a CSV file by clicking the ![]() icon.
icon.