Monitoring NetApp E-Series Storage
eG Enterprise provides a specialized NetApp E-Series Storage model.
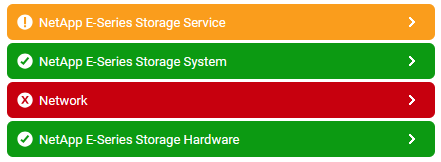
Figure 1 : Layer model for NetApp E-Series Storage
Each layer in is mapped to tests that report metrics related to the NetApp E-Series Storage. Using the metrics reported by this test, administrators can find accurate answers for the following performance queries:
-
Is the target storage system available?
-
Is the response time of any volume abnormal? If yes, then, is it abnormal during reads or writes?
-
Is the read/write cache utilization high on any volume?
-
Is any storage interface experiencing abnormal read/write IOPS and throughput?
-
Is any controller experiencing erratic read/write IOPS and throughput patterns?
-
Is any disk taking too long to respond to read/write requests?
-
Is any disk experiencing abnormal read/write IOPS?
-
Is any disk consistently experiencing high queue depth?
-
Is the target storage system experiencing erratic read/write IOPS and throughput patterns?
-
Has any battery of the target storage system removed/failed/expired? Is the temperature of any battery abnormal?
-
Is any controller of the target storage system removed? Is any controller in Failed or Degraded or Suspended state?
-
Is any disk within the target storage system unavailable? Is there any unresponsive or incompatible disk?
-
Is any disk of the target storage system in Failed or Removed state?
-
Has any hardware component such as fan, power supply or thermal sensor been removed from the target storage system?
Since the Network layer have already been dealt with in the Monitoring Windows and Unix Servers document, this chapter will discuss the other layers only.