Detailed Diagnostics Revealing that an Inefficient Database Query is the Reason for a Slow Transaction
Let us consider the example of a web application that has been deployed on Apache web server, PHP_BTM:8055. The eG PHP Profiler has detected that the following transactions to that web application are slow.
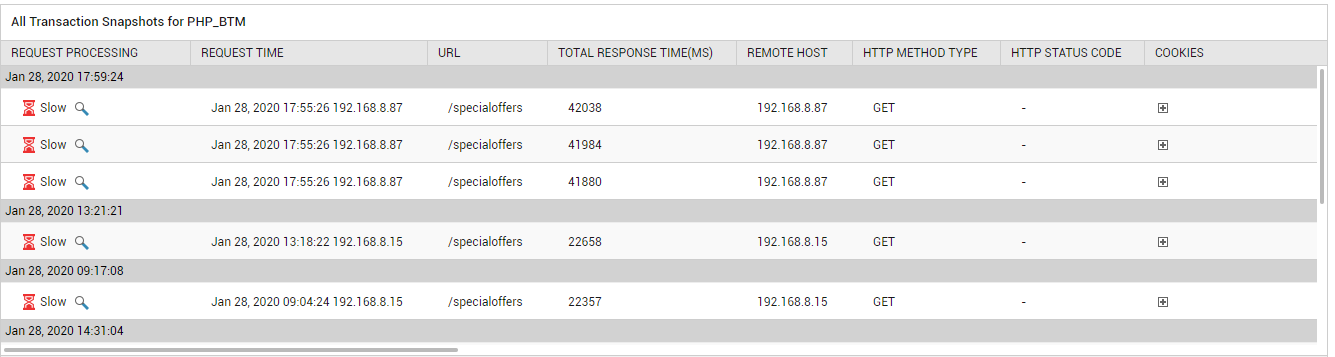
Figure 8 : The detailed diagnosis of the Avg response time measure revealing the slow URLs
Since the requests are arranged in the descending order of their response time, a quick look at the detailed diagnostics will lead you to the precise request that is the slowest. But, why is response to this request slow? To answer this question, click the ‘magnifying glass’ icon against Slow in the transaction user experience column of the slowest request (i.e., the topmost request in Figure 8).
Figure 9 will then appear revealing the cross-application flow of the slow transaction.
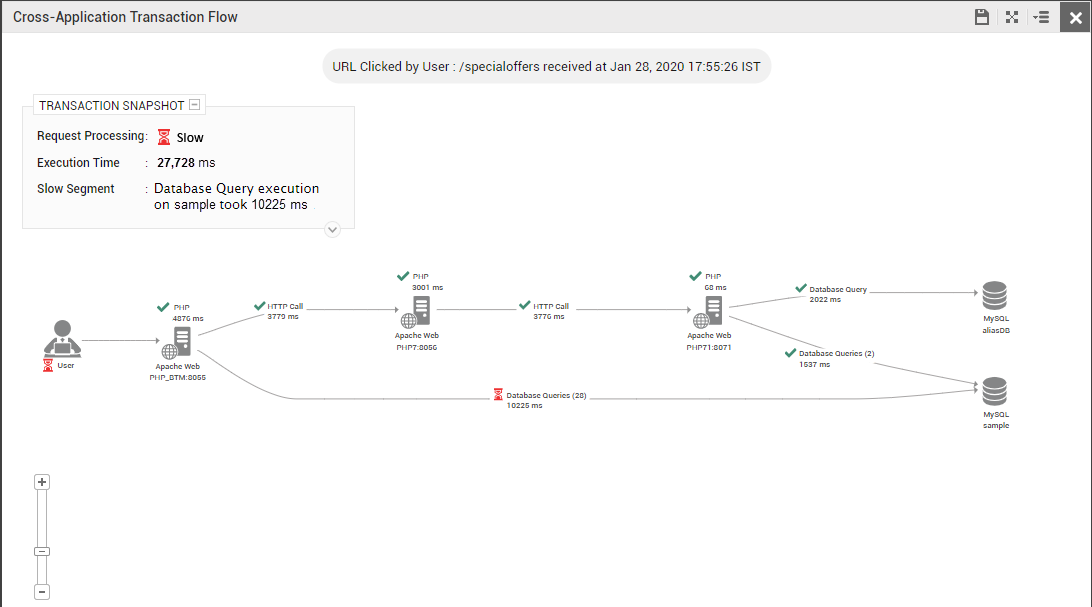
Figure 9 : The cross-application flow of the slow transaction revealing that many database queries are slow
This flow diagram clearly reveals the following:
- The PHP web servers and backends through which the transaction travelled;
- The time for which the transaction request was processed at each BTM-enabled PHP server; note that this time will not be computed for PHP servers that are in the transaction path, but are not BTM-enabled and those that are BTM-enabled but are not managed by eG;
-
The exit calls made by each BTM-enabled node to another node as part of the transaction's journey, the time consumed by each exit call, and the number of times each type of call was made;
Note:
-
If a BTM-enabled node appears 'grayed out' in the cross-application transaction flow, it denotes that eG BTM could not collect detailed diagnostics for that node. The reasons for this could be either or both of the following:
- Transaction responsiveness on the 'grayed out' node was either healthy or was only slightly slow, and hence, did not appear in the list of Top-N slow transactions.
- Slow data transmission from eG agent to manager;
- If a PHP node makes a SQL query call on a database server, then the details displayed for that database server in the transaction topology depends upon whether/not that database server is managed by eG Enterprise. If the database server is not managed by eG Enterprise, then such a database server will be represented in the topology using the server type (whether Oracle, Microsoft SQL etc.) and the name of the database that was accessed by the SQL query. To know the IP and port number of the unmanaged database server, you can drill-down from the Database queries call in the topology. On the other hand, if the database server in question is being monitored by eG Enterprise, then such a server will be represented in the topology using the server type, nick name, port number, and the database name. Additionally, the SID will be displayed in case of an Oracle database server, and the instance name will be displayed in case of an instance-based Microsoft SQL server.
-
Sometimes, empty nodes – i.e., nodes without any details – will be visible in the cross-application transaction flow topology. Likewise, the time spent on certain external calls may also not be displayed in the topology. This is owing to inconsistencies in the collection of detailed diagnostics.
Using conventional color codes and intuitive icons, the transaction flow chart precisely pinpoints where the transaction slowed down. In the case of Figure 9 above, from the color-coding it is clear that the database queries executed by the Apache web server – PHP_BTM:8055 - is taking a long time for execution. The question now is which exact query is this. To determine that, click on Database Queries in Figure 9.
Figure 10 that then appears, automatically opens the list of SQL Queries executed by the slow transaction in question. The execution time of each query and what percentage of the total response time of the transaction each query is consuming will be displayed here. From Figure 10, it is evident that a 'select name_en AS name...' query is taking over 1500 milliseconds for execution . This time-consuming query is what is causing the transaction to slow down. To view the complete query, click on that query in the SQL Queries list of Figure 10. The detailed query will then be displayed in the Query section of Figure 10.
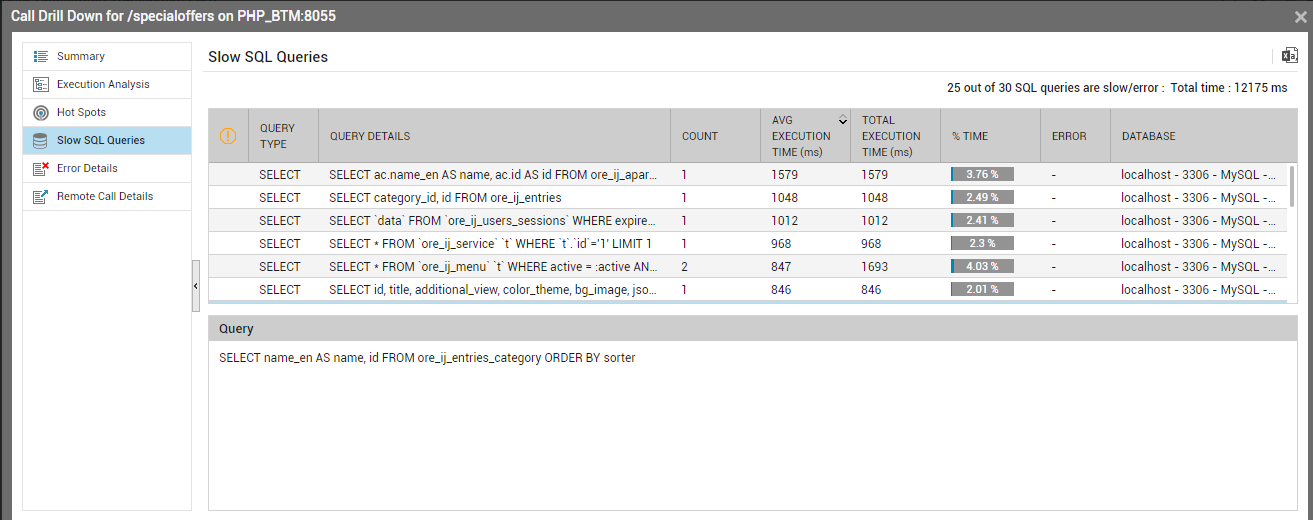
Figure 10 : Analyzing slow queries
This way, using a short sequence of mouse clicks, you have zeroed-in on the source of the transaction slowness.