File and Page Activities Test
Users perform many operations on the files stored in document libraries. Users can access files, view their contents, modify them, rename them, and even delete them. Likewise, users can view SharePoint pages in a site. To be able to efficiently audit the operations that are performed on files and pages, administrators should track each operation closely, determine whether it is a file operation or page operation, accurately identify what operation it is (file access, page view, file modifications, etc.), and also pinpoint which user performed that operation. This is exactly what the File and Page Activities test helps administrators do!
This test tracks the file and page operations that users perform on SharePoint Online and reports the total count of operations of each type. The type of operations that is most commonly performed on SharePoint Online is thus revealed to administrators. Additionally, the count of unique users who performed the various file/page operations is reported, with detailed diagnostics pointing administrators to the precise users and the operations they performed. This helps administrators identify users who may have performed an unauthorized operation. The unique clients from which the users initiated the file/page operations, the unique sites where the files are stored, and the unique pages viewed are provided as part of detailed diagnostics, so as to enable administrators audit the operations efficiently.
Target of the test : Microsoft SharePoint Online
Agent deploying the test : A remote agent
Outputs of the test : One set of results for the Office 365 tenant being monitored
| Parameters | Description |
|---|---|
|
Test period |
How often should the test be executed |
|
Host |
The host for which the test is to be configured. By default, this is portal.office.com |
|
Tenant Name |
This parameter applies only if you want the eG agent to use Azure AD Certificate-based Authentication for accessing and monitoring an O365 tenant and its resources. Azure AD certificate-based authentication (CBA) enables customers to allow or require users to authenticate with X.509 certificates against their Azure Active Directory (Azure AD) for applications and browser sign-in. When monitoring highly secure Office 365 environments, you can configure the eG agent to identify itself to a tenant using a valid X.509 certificate, so that it is allowed secure access to the tenant and its resources. By default, the value of this parameter is none. This means that, by default, the eG agent does not use certificate-based authentication to connect to an O365 tenant. On the other hand, if you want the eG agent to use this modern authentication technique to securely access a tenant's resources, you should do the following:
|
|
O365 User Name, O365 Password, and Confirm Password |
For execution, this test requires the privileges of an O365 user who has been assigned theService support admin and SharePoint admin roles and is vested with the View-Only Audit Logs permission. Configure the credentials of such a user against O365 User Name and O365 Password text boxes. Confirm the password by retyping it in the Confirm Password text box. While you can use the credentials of any existing O365 user with the aforesaid privileges, it is recommended that you create a special user for monitoring purposes using the Office 365 portal and use the credentials of that user here. To know how to create a new user using the Office 365 portal and assign the required privileges to that user, refer to Creating a New User in the Office 365 Portal |
|
Domain, Domain User Name, Domain Password, and Confirm Password |
These parameters are applicable only if the eG agent needs to communicate with the Office 365 portal via a Proxy server. In this case, in the Domain text box, specify the name of the Windows domain to which the eG agent host belongs. In the Domain User Name text box, mention the name of a valid domain user with login rights to the eG agent host. Provide the password of that user in the Domain Password text box and confirm that password by retyping it in the Confirm Password text box. On the other hand, if the eG agent is not behind a Proxy server, then you need not disturb the default setting of these parameters. By default, these parameters are set to none. |
|
Proxy Host, Proxy Port, Proxy User Name, and Proxy Password |
These parameters are applicable only if the eG agent needs to communicate with the Office 365 portal via a Proxy server. In this case, provide the IP/host name and port number of the Proxy server that the eG agent should use in the Proxy Host and Proxy Port parameters, respectively. If the Proxy server requires authentication, then specify the credentials of a valid Proxy user against the Proxy User Name and Proxy Password text boxes. Confirm that password by retyping it in the Confirm Password text box. If the Proxy server does not require authentication, then specify none against the Proxy User Name, Proxy Password, and Confirm Password text boxes. On the other hand, if the eG agent is not behind a Proxy server, then you need not disturb the default setting of any of the Proxy-related parameters. By default, these parameters are set to none. |
|
Report System Account Log Entries |
By default, this flag is set to No. This means that, by default, the test ignores all operations performed by Windows System Accounts. A System Account in Windows is used by the operating system and by services that run under Windows. There are many services and processes within Windows that need the capability to log on internally (for example during a Windows installation). The system account was designed for that purpose; it is an internal account, does not show up in User Manager, cannot be added to any groups, and cannot have user rights assigned to it. On the other hand, the system account does show up on an NTFS volume in File Manager in the Permissions portion of the Security menu. By default, the system account is granted full control to all files on an NTFS volume. Here the system account has the same functional privileges as the administrator account.. If you want the test to monitor and report on operations performed by Windows System Accounts as well, set this flag to Yes. Note: By default, this test does not monitor the operations of the NT AUTHORITY\SYSTEM and SHAREPOINT\system accounts. This is governed by the System_Account_Names parameter in the [SPO_Audited_Activities] section of the eg_tests.ini file (in the <EG_INSTALL_DIR>\manager\config directory). If required, you can exclude more Windows system accounts from monitoring. For that, do the following:
|
|
DD Frequency |
Refers to the frequency with which detailed diagnosis measures are to be generated for this test. The default is 2:1. This indicates that, by default, detailed measures will be generated every second time the test runs, and also every time the test detects a problem. You can modify this frequency, if you so desire. Also, if you intend to disable the detailed diagnosis capability for this test, you can do so by specifying none against DD Frequency. |
|
Detailed Diagnosis |
To make diagnosis more efficient and accurate, the eG Enterprise embeds an optional detailed diagnostic capability. With this capability, the eG agents can be configured to run detailed, more elaborate tests as and when specific problems are detected. To enable the detailed diagnosis capability of this test for a particular server, choose the On option. To disable the capability, click on the Off option. The option to selectively enabled/disable the detailed diagnosis capability will be available only if the following conditions are fulfilled:
|
| Measurement | Description | Measurement Unit | Interpretation |
|---|---|---|---|
|
Total operations |
Indicates the total number of file and page operations that were performed by users of SharePoint Online. |
Number |
The value of this measure is the sum of the values of all measures reported under the section File/Page Operations, in the Layers tab page of the eG monitoring console |
|
Unique operations |
Indicates the count of unique file/page operations performed on SharePoint Online. |
Number |
To know which operations were performed, use the detailed diagnosis of this measure. |
|
Unique users |
Indicates the count of unique users who performed file/page operations on SharePoint Online. |
Number |
To know which are the users who performed a file/page operation, use the detailed diagnosis of this measure. |
|
Unique client IPs |
Indicates the number of unique clients from which the users initiated the file/page operations. |
Number |
Use the detailed diagnosis of this measure to determine the IP addresses of the clients from which users performed a file/page operation. |
|
Unique sites |
Indicates the number of unique sites where the files/pages accessed, reside. |
Number |
Use the detailed diagnosis of the SharePoint Online sites that were accessed for performing a file/page operation. |
|
Affected item types |
Indicates the number of types (file and/or page) of items that were affected by user operations. |
Number |
To know what type of items were affected by the user operations, use the detailed diagnosis of this measure. |
|
Unique destinations |
Indicates the destination URLs of the file/page operations . |
Number |
To know the unique destination URLs, use the detailed diagnosis of this measure. |
|
Unique user agents |
Indicates the unique user agents of browsers used for performing file/page operations. |
Number |
To know the unique user-agent strings of the browsers used in file/page operations, use the detailed diagnosis of thi measure. |
|
File accesses |
Indicates the number of file access operations that were performed. |
Number |
If you want to make changes to a file on a site and you want to make sure no one else can edit it, check out the file. When you have the file checked out, you can edit it online or offline, and save it—multiple times, if necessary. When you finish editing a file, you need to check the file back into the library, so that other people can see your changes and edit the file, if they have permission. If you decide not to make or keep any changes in the file, you can simply discard your checkout so you do not affect version history. |
|
File check-ins |
Indicates the number of times files were checked in. |
Number |
|
|
File checkouts |
Indicates the number of file checkout operations performed. |
Number |
|
|
File checkout discards |
Indicates the number of file checkout discards performed. |
Number |
|
|
File copies |
Indicates the number of times files were copied. |
Number |
|
|
File deletes |
Indicates the number of times file delete operations were performed. |
Number |
|
|
File deletes from I stage recycle bin |
Indicates the number of file deletes performed from the first-stage recycle bin. |
Number |
The Recycle Bin in SharePoint Online in Office 365 for business provides a safety net when an site content and site collections are deleted. When you delete content from a SharePoint site, it’s sent to the site's Recycle Bin or first-stage Recycle Bin, where you can restore the deleted content if needed. If the file is deleted from the site Recycle Bin (i.e., from the first-stage Recycle Bin), it is sent to the Site Collection or Second-Stage Recycle Bin, where a site collection administrator can restore it or delete it permanently. |
|
File deletes from II stage recycle bin |
Indicates the number of files deleted from the second-stage recycle bin. |
Number |
|
|
File downloads |
Indicates the number of times users have downloaded files from SharePoint Online. |
Number |
|
|
File modifications |
Indicates the number of times files on SharePoint Online have been modified. |
Number |
|
|
File moves |
Indicates the number of times files have been moved. |
Number |
Files on SharePoint Online can be moved to a different destination in the current library, to OneDrive, or to another SharePoint site. |
|
File renames |
Indicates the number of times files have been renamed. |
Number |
|
|
File restores |
Indicates the number of times files have been restored from the Recycle Bin to their original location. |
Number |
|
|
File uploads |
Indicates the number of file uploads to SharePoint Online. |
Number |
|
|
Page views |
Indicates the number of times SharePoint pages have been accessed. |
Number |
|
The detailed diagnosis of the Unique operations measure lists the unique file/page operations that were performed, and the number of times each operation was performed. This way, administrators can quickly identify which operation was most common.
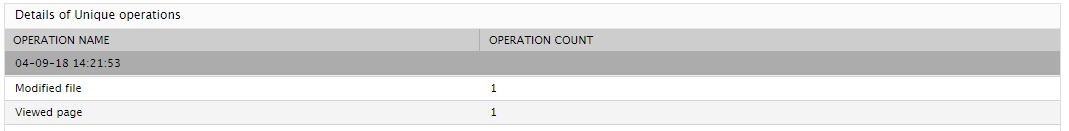
Figure 1 : The detailed diagnosis of the Unique operations measure
The detailed diagnosis of the Unique users measure lists the users who performed file/page operations on SharePoint Online. For each user, the operations performed by that user, the number of times the operations were performed, and the client from which that user initiated the operations are revealed. This way, administrators can quickly figure out if any user has performed any unauthorized operation.

Figure 2 : The detailed diagnosis of the Unique users measure
The detailed diagnosis of the Unique client IPs measure reveals which user operations were performed from which clients. The number of times the operations were performed from each client is also reported.

Figure 3 : The detailed diagnosis of the Unique client IPs measure
The detailed diagnosis of the Unique sites measure reveals the GUID and URL of each of the SharePoint sites on which file/page operations were performed. The type of operation that was performed and the number of times these operations were performed is also reported, so that administrators can accurately identify the site that experienced a high level of activity.
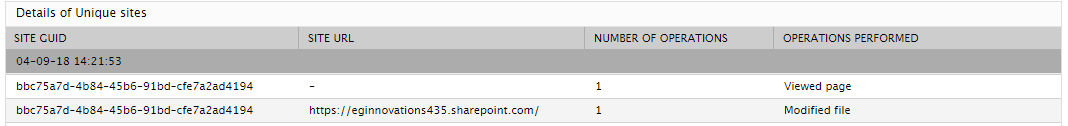
Figure 4 : The detailed diagnosis of the Unique sites measure
To know which type of items - i.e., whether files or pages - was the target of the maximum number of operations, use the detailed diagnosis of the Affected item types measure. For each item type, the detailed metrics reveal the type of operations performed on that type and the number of times the operations were performed.
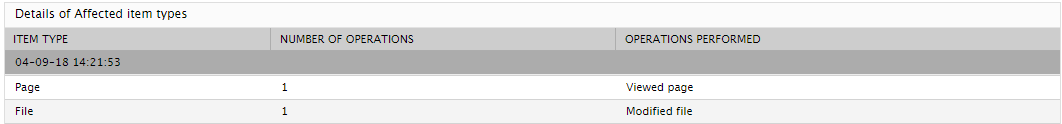
Figure 5 : The detailed diagnosis of the Affected item types measure
The detailed diagnosis of the Unique destinations measure lists the destination URLs of the file/page operations. For each URL, the operations that resulted in the URL and the number of times the operations were performed are reported.

Figure 6 : The detailed diagnosis of the Unique destinations measure
The detailed diagnosis of the Unique user agents measure lists the user-agent strings of browsers used by users for performing the different file/page operations. For each user-agent string, the detailed metrics further reveals the number of operations performed using that browser. This will help administrators to identify the browser that was used most often to perform file/page operations.
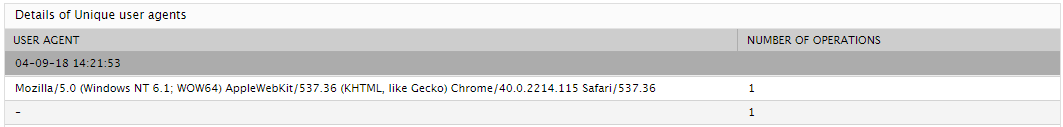
Figure 7 : The detailed diagnosis of the Unique user agents measure