Applications-Launches Report
Citrix administrators are often interested in auditing user activity on their XenApp farms. They would like to understand who accessed each application in the farm and for how long. The Applications-Launches report addresses this need. Using the information in this report, administrators can determine which applications are most accessed, by whom and for how long. This information can also be useful if Citrix administrators have to bill different organizations in an enterprise for usage of the different applications published in the Citrix XenApp farm.
To generate this report, do the following:
- Select the Launches option by following the menu sequence: REPORTS BY FUNCTION -> Domain-specific Reports ->Virtual Applications / Desktops -> Applications
-
When Figure 1 appears, do the following:

- Choose a Report Type (Graph or Data) for generating the report. The default Report Type is Graph. A Graph report graphically represents the measure data.
- Select the Zone to which the servers of interest to you belong. If no zones have been configured in your environment, then all the managed servers in the environment will be automatically grouped under a zone named Default; in such cases therefore, select the Default zone.
- Next, from the Component Type list, select the virtual server type for which this report is to be generated.
- In the Component list box, all the components pertaining to the chosen Component Type will be listed. If the Component list consists of too many virtual servers, then viewing all the components and selecting the ones you need for report generation could require endless scrolling. To avoid this, you can click the
 icon next to the Component list. This will open the COMPONENTS pop up window using which you can view almost all the components in a single interface and Select the ones for which the report is to be generated. If there are still too many components in the list to choose from, you can narrow your search further by using the Search Components text box. Specify the whole/part of the component name to search for in this text box, and click the
  icon next to it. The Component list will then be populated with all component names that embed the specified search string.
 - If you wish to generate the report based on the overall access of the Applications in your environment, select Application from the Details based on list. For a detailed report on the application access of each user in your environment, select the User option.
- In the Application list box, all the applications pertaining to the chosen Components will be listed. If the Applications list consists of too many applications, then viewing all the applications and selecting the ones you need for report generation could require endless scrolling. To avoid this, you can click the icon next to the Applications list. This will open the APPLICATIONS pop up window using which you can view almost all the applications in a single interface and Select the ones for which the report is to be generated. If there are still too many applications in the list to choose from, you can narrow your search further by using the Search Applications text box. Specify the whole/part of the application name to search for in this text box, and click the icon next to it. The Applications list will then be populated with all application names that embed the specified search string. Select the application of your choice from this list.
-
Then, specify the Timeline for the report. You can either provide a fixed time line such as 1 hour, 2 days, etc., or select the Any option from the list to provide a From and To date/time for report generation.
Note:
For every user registered with the eG Enterprise system, the administrator can indicate the maximum timeline for which that user can generate a report. Once the maximum timeline is set for a user, then, whenever that user logs into eG Reporter and attempts to generate a report, the Timeline list box in the report page will display options according to the maximum timeline setting of that user. For instance, if a user can generate a report for a maximum period of 3 days only, then 3 days will be the highest option displayed in the Timeline list - i.e., 3 days will be the last option in the fixed Timeline list. Similarly, if the user chooses the Any option from the Timeline list and proceeds to provide a start date and end date for report generation using the From and To specifications, eG Enterprise will first check if the user's Timeline specification conforms to his/her maximum timeline setting. If not, report generation will fail. For instance, for a user who is allowed to generate reports spanning over a maximum period of 3 days only, the difference between the From and To dates should never be over 3 days. If it is, then, upon clicking the Run Report button a message box will appear, prompting the user to change the From and To specification.
-
In addition to the settings discussed above, this report comes with a set of default specifications. These settings are hidden by default. If you do not want to disturb these default settings, then you can proceed to generate the report by clicking the Run Report button soon after you pick the criteria for generating the report. However, if you want to view and then alter these settings (if required), click on the
 button. The default settings will then appear in the MORE OPTIONS drop down window (see Figure 2). The steps below discuss each of these settings and how they can be customized.
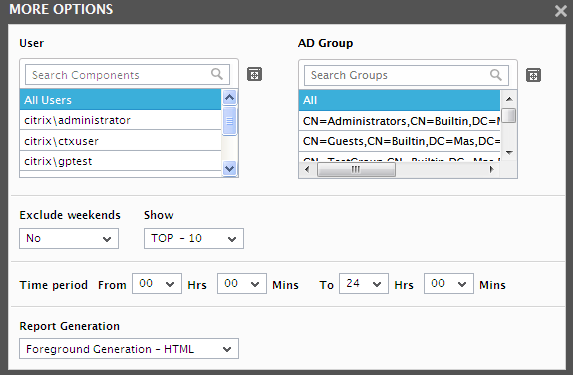
Figure 2 : The default settings for generating the Application Launch report
-
In the User list box, all the users logged into the chosen Components will be listed. If the User list is too long, then viewing all the users and selecting the ones you need for report generation could require endless scrolling. To avoid this, you can click the
icon next to the User list. This will open the USER pop up window using which you can view almost all the users in a single interface and Select the ones for which the report is to be generated. If there are still too many users in the list to choose from, you can narrow your search further by using the Search User text box. Specify the whole/part of the user name to search for in this text box, and click the icon next to it. The User list will then be populated with all user names that embed the specified search string. Select the user of your choice from this list. Note:
The Applications list and the User list will toggle between the APPLICATION LAUNCH page and the MORE OPTIONS drop down window based on the option chosen from the Details based on list.
-
By default, this report will list the Top 10 applications launched, if the Report Type chosen is Graph. If you wish to view generate the report for the number of applications launched of your choice, then, you may do so by selecting an option from the Show list box. By default, the Top - <maximum number of active components for the test> will be the option chosen here - i.e., if this test takes a maximum of 5 components, then the Top - 5 option will be selected here, by default.
Note:
The options to be listed in the Show list can be configured in the eg_report.ini file in the <EG_INSTALL_DIR>\manager\config directory. To achieve this, set the ShowTop parameter in the [INFOS] section of this list to a specific numeric value. For example, if you set ShowTop to 10, then the Show list will display the following options: Top-10, Top-2, Top-5, Last-10, Last-2, and Last-5.
-
If the Report Type is Data, then a Group by list appears in the MORE OPTIONS pop up window. By default, User option is chosen from this list indicating that this report will provide you the details of the servers through which each user accessed the chosen applications. If Component is chosen from this list, then this report provides you the details of the users who have accessed each of the servers and accessed the chosen applications.
-
Specify the start time and end time for report generation against the Time period field (see Figure 2).
Note:
The default Time period to be displayed here can be configured using the consolidated reports page in the eG administrative interface; to access this page, follow the menu sequence: Settings -> Reporter -> Consolidated Reports. For more details regarding this page, refer to Section Consolidated Reports of this manual.
-
If the timeline specified for the report needs to exclude the data collected during the Weekends, then set Exclude weekends to Yes. If not, select No.
Note:
By default, the weekend constitutes Saturday and Sunday. To override this default setting, do the following:
- Edit the eg_report.ini file in the <eg_install_dir>\manager\config directory.
- In the [MEASURE_GROUP] section of the file, the EXCLUDE_WEEKEND parameter is set to Saturday,Sunday by default. You can modify this by setting the EXCLUDE_WEEKEND parameter to a comma-separated list of other days of the week - say Friday,Saturday.
- Save the file after making the required changes.
-
In large environments, reports generated using months of data can take a long time to complete. Administrators now have the option of generating reports on-line or in the background. When a report is scheduled for background generation, administrators can proceed with their other monitoring, diagnosis, and reporting tasks, while the eG manager is processing the report. This saves the administrator valuable time. To schedule background processing of a report, you can either select the Background Save - PDF option or the Background Save - CSV option from the Report Generation list. In this case, a Report Name text box will appear, where you would have to provide the name with which the report is to be saved in the background. To process reports in the foreground, select the Foreground Generation - HTML option from this list.
Note:
- The Report Generation list will appear only if the EnableBackgroundReport flag in the [BACKGROUND_PROCESS] section of the eg_report.ini file (in the <EG_INSTALL_DIR>\manager\config directory) is set to Yes.
- The default selection in the Report Generation list will change according to the Timeline specified for the report. If the Timeline set is greater than or equal to the number of days specified against the MinDurationForReport parameter in the [BACKGROUND_PROCESS] section of the eg_report.ini file, then the default selection in the Report Generation list will be Background Save - PDF. On the other hand, if the Timeline set for the report is lesser than the value of the MinDurationForReport parameter, then the default selection in the Report Generation list will be Foreground. This is because, the MinDurationForReport setting governs when reports are to be processed in the background. By default, this parameter is set to 2 weeks - this indicates that by default, reports with a timeline of 2 weeks and above will be processed in the background.
-
Finally, click the Run Report button to generate the report.
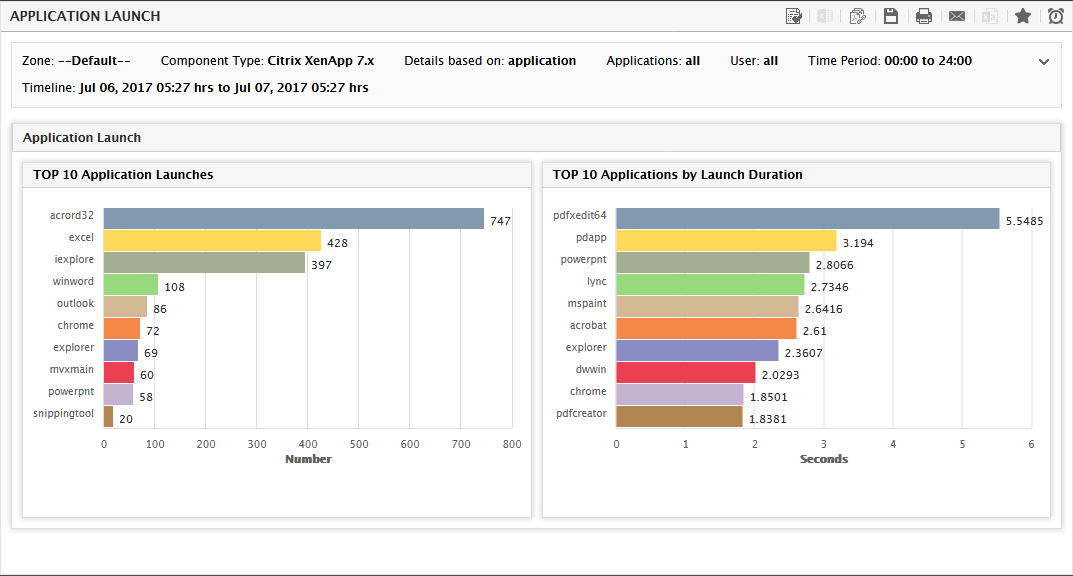
- If you have chosen the Graph option from the Report Type list and the Application option from the Details based on list, then a bar graph displaying the Top-N applications launched in the target environment will appear (see Figure 3) along with the Top-N time taken to launch the applications.
-
If you have chosen the Graph option from the Report Type list and the User option from the Details based on list, then this report will be generated for the Top-N users who have launched the maximum number of applications in the target environment (see Figure 4).
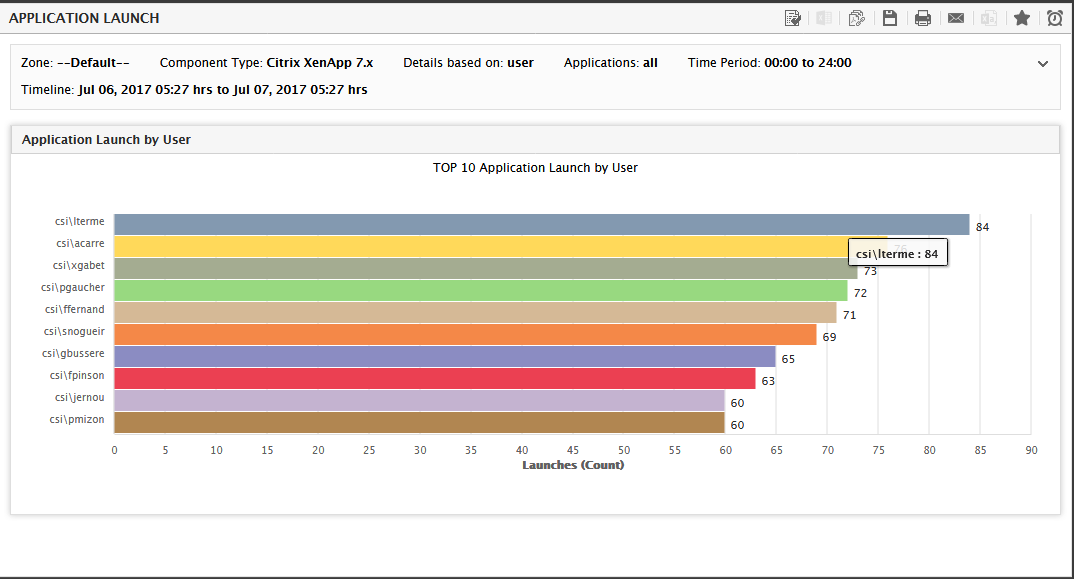
Figure 4 : The Application Launch Report for the top users of your environment
-
If you have chosen the Data option from the Report Type list and the Application option from the Details based on list, then the report will list the number of times each Application was launched (see Figure 5), the number of unique applications that were launched and the number of unique users who launched the application.
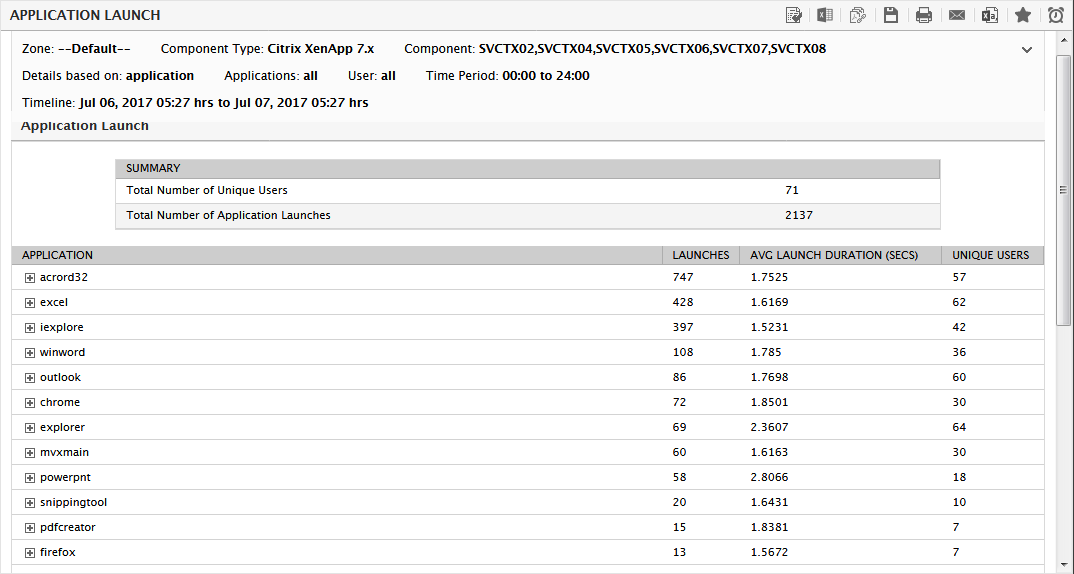
Figure 5 : The data report when the Application option is chosen from the Details based on list
-
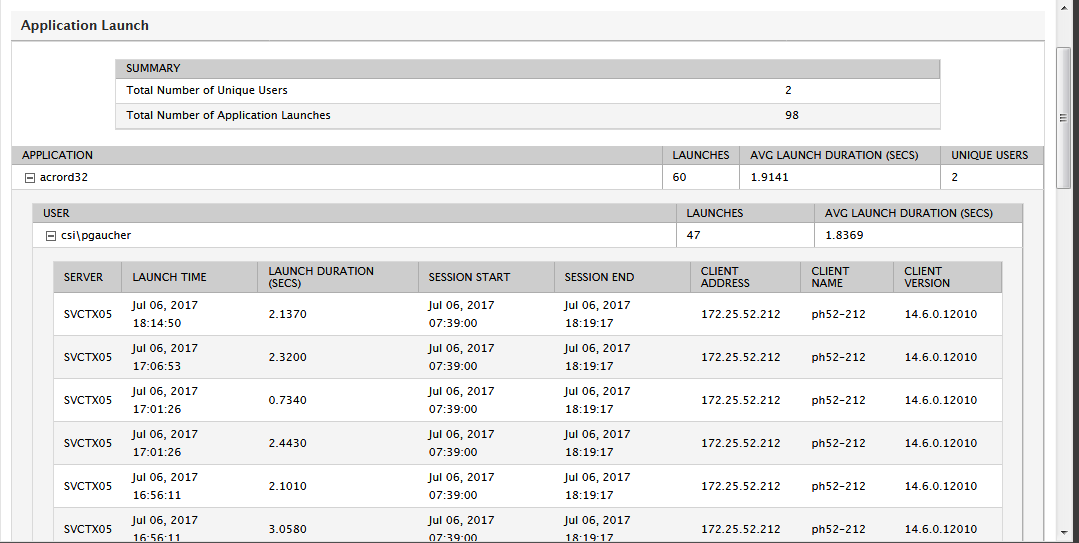
Further drilling down each Application will reveal Figure 6 using which you can understand how well each USER has accessed the application and how many times the application was accessed by each User, the time at which the application was launched, the duration for which the application was launched, the start and end time of the user session during which the application was launched, the client IP address, the client name and the client version that was used to launch the application.
-
If you have chosen Data option from the Report Type list and the User option from the Details based on list, then the report as shown in Figure 7 will list the USERS logged into the chosen components and the total number of times he/she has accessed the applications from the chosen component.
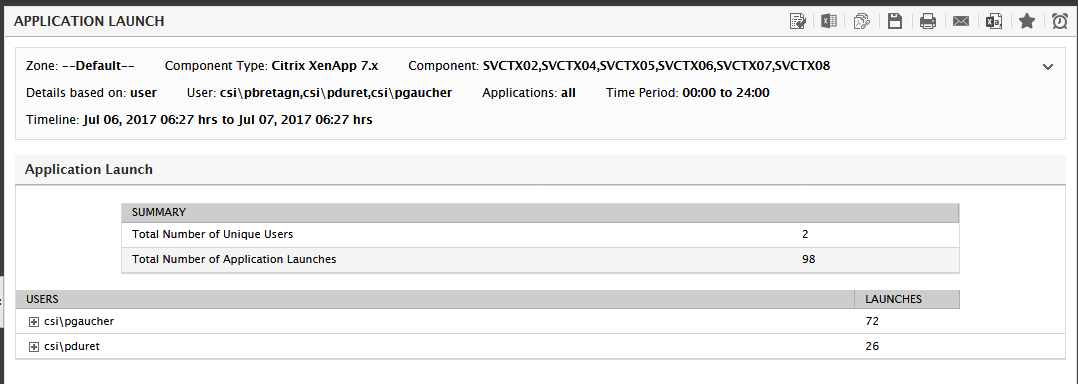
Figure 7 : The Data Application report when User option is selected from the Details based on list
-
Further drilling down each USER of Figure 7 will list out the applications accessed by the user and the number of times each application was accessed (see Figure 8).
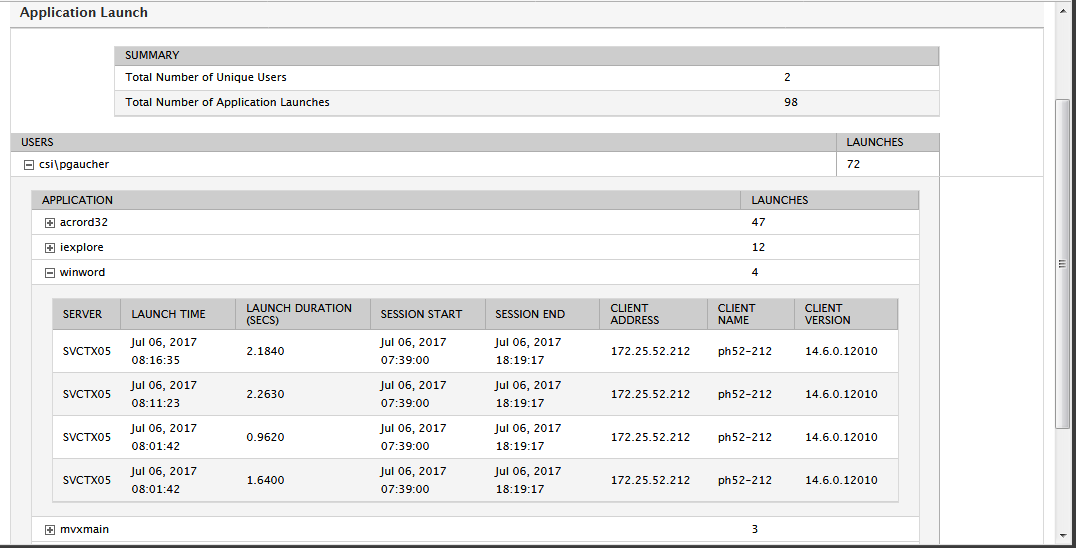
Figure 8 : Detailed data report for each application launch by the user
-
Clicking on each Application will further provide you with the access details i.e., you can figure out the time at which the application was launched, the start time and end time of the session during which the application was launched, the time taken to launch the application, the client address, client name and the version of the client (see Figure 8).
Note:
In large environments, administrators may wish to view only the number of times the application was launched and the user who launched the application and they are least bothered about the session duration, session start time and end time. For such administrators, eG Enterprise provides an option to disable the session related statistics displayed for each launched application/user launching the application. To disable the session related metrics from the generated report, administrators need to set the needOptimization flag in the eg_report.ini file to Yes and set the ShowSessionDetails flag to No.